

TL;DR:
- Trading simulation allows traders to practice and validate strategies in realistic market conditions without risking real capital. It accelerates learning, improves mechanical skills, and provides quantitative performance metrics, but cannot fully replicate psychological pressures or account for idealized fills. Using Monte Carlo analysis further enhances risk assessment by revealing worst-case scenarios, guiding better account sizing and transition strategies for live trading.
Trading simulation is defined as the practice of replicating live market conditions in a controlled environment so traders can develop, test, and validate strategies without risking real capital. The role of simulation in trading has expanded significantly, with tools ranging from replay-driven simulators like FX Replay to Monte Carlo analysis platforms used by quantitative desks at hedge funds. Whether you trade crypto on Binance, forex on MetaTrader, or equities through a prop firm like Topstep, simulation gives you a structured path from raw idea to battle-tested strategy. This guide breaks down how these tools work, what they actually deliver, and where they fall short.
How does trading simulation work in real markets?
A trading simulator replicates market conditions by feeding real historical or live price data through an execution engine that models order types, fills, slippage, and commissions. The result is a trading environment that mirrors what you would face on a live exchange, without the financial consequences of being wrong.
The mechanics vary by platform, but the core components are consistent:
-
Price data: Tick-by-tick or OHLCV data sourced from real exchanges or data vendors like Refinitiv or Bloomberg.
-
Order execution modeling: Market orders, limit orders, and stop orders are processed against simulated order book depth.
-
Slippage and commissions: Realistic simulators apply dynamic slippage based on order size relative to available liquidity, plus tiered commission structures.
-
Replay functionality: Platforms like FX Replay or TradingView let you replay historical sessions candle by candle, pause at decision points, and re-trade scenarios with full performance analytics.
It is worth distinguishing between three commonly confused tools. A simulator replays historical data in real time for manual practice. A demo account connects to live feeds but uses virtual funds. Backtesting runs a coded strategy automatically over historical data. Each serves a different purpose, and serious traders use all three at different stages of strategy development.
The psychological dimension is where simulators often disappoint. Standard paper trading removes the financial consequence of loss, which fundamentally changes decision-making. Prop firm simulators address this by charging real fees and terminating accounts on rule violations, creating genuine skin in the game that standard demo accounts cannot replicate.

Pro Tip: When using a simulator, set a personal daily loss limit equal to what you would set in live trading. Treating every simulated loss as real money trains the discipline you will need when the stakes are actual.
What are the benefits and limitations of trading simulations?
The trading simulation benefits are concrete and measurable, but they come with real constraints that you need to understand before drawing conclusions from your results.
Core advantages
-
Accelerated pattern recognition. Traders can execute hundreds of trades in a single day by replaying compressed historical sessions. What would take months of live market exposure can be achieved in days, dramatically speeding up the feedback loop between hypothesis and evidence.
-
Mechanical fluency. Simulators reduce cognitive load by letting you master platform navigation, order entry, and position sizing before these tasks compete with strategic thinking in live conditions. Fewer mechanical errors means better decision quality when real money is on the line.
-
Data-driven strategy metrics. Simulation allows you to collect meaningful metrics including win rate, expectancy, maximum drawdown, and profit factor. These numbers transform subjective trading instincts into quantifiable, comparable data points you can use to refine entries, exits, and position sizing.
-
Risk-free strategy validation. You can validate your trading strategies across multiple market regimes, from trending to ranging to high-volatility environments, before committing a single dollar of real capital.
Real limitations you cannot ignore
“The biggest risk of simulators is overconfidence from misinterpreting positive simulated results as readiness for live trading. Success depends on treating simulation as deliberate training with structured goals, not casual play.” — Power Trading Group
Beyond overconfidence, two structural limitations affect every simulator. First, fills in simulation are typically idealized. Actual executions differ from simulation fills because live order books have gaps, large orders move prices, and volatile moments produce slippage that no static model fully captures. Second, the emotional gap between simulated and live trading is real. Knowing that a loss costs you nothing changes how you hold a losing position, how aggressively you size up, and how quickly you abandon a plan. Understanding trading psychology is the missing layer that simulation alone cannot provide.
What are Monte Carlo simulations and why do traders use them?
Monte Carlo simulation is a probabilistic analysis technique that reshuffles your historical trade results thousands of times to generate a distribution of possible outcomes, rather than relying on a single historical path. For traders, this is the difference between knowing your strategy made money last year and knowing how it is likely to perform across a wide range of future conditions.
Here is how standard backtesting compares to Monte Carlo analysis:
| Feature | Standard backtest | Monte Carlo simulation |
|---|---|---|
| Path analyzed | Single historical sequence | Thousands of reshuffled sequences |
| Drawdown insight | One observed drawdown | 95th percentile worst-case drawdown |
| Losing streak visibility | Historical maximum only | Probabilistic range of streaks |
| Account sizing guidance | Based on past results | Based on simulated worst-case scenarios |
| Confidence level | Low (one data point) | High (statistical distribution) |
Monte Carlo simulations reshuffle historical trade results thousands of times, revealing the 95th percentile of maximum losing streaks that single-path backtesting completely misses. That insight directly informs how much capital you need to survive your strategy’s realistic worst case, not just its historical one.
Beyond Monte Carlo, production-grade simulation engines model slippage as a dynamic function of ATR and order size relative to volume. Commissions are tiered and include borrow costs for short positions. Four critical execution elements must be modeled in any serious simulation: slippage, transaction costs, liquidity constraints, and look-ahead bias. Ignoring any one of these produces backtest results that diverge catastrophically from live performance, a phenomenon researchers call the “backtesting delusion.”
Pro Tip: Size your live trading account to the 95th percentile drawdown from your Monte Carlo results, not the average. This single adjustment prevents the most common reason traders blow up after a successful backtest.
Best practices for simulation and transitioning to live trading
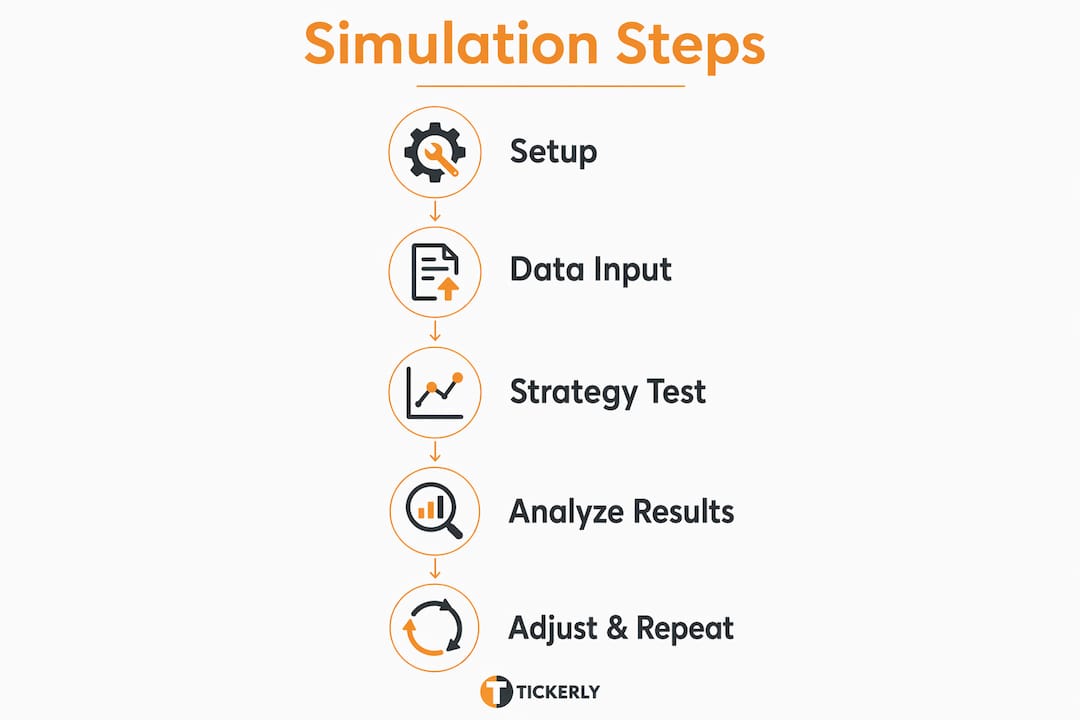
Effective simulation is deliberate practice, not casual screen time. The traders who extract the most value from simulators treat each session as structured training with specific, measurable objectives. Here is how to build that discipline into your process:
-
Write a game plan before each session. Define which setup you are practicing, your entry criteria, stop placement rules, and profit target logic. Reviewing adherence to the plan matters more than reviewing profit and loss.
-
Focus on one setup for 30 days. Rotating through multiple setups prevents deep pattern recognition. Mastery of a single, well-defined setup produces more reliable metrics than surface-level familiarity with ten.
-
Apply strict daily loss limits. Set a maximum daily loss in simulation that mirrors what you would accept in live trading. Stopping when you hit it builds the habit of capital preservation before it costs you real money.
-
Journal every trade. Record entry rationale, execution quality, and emotional state. Patterns in your journal reveal systematic errors that raw performance metrics cannot show.
-
Avoid common trading mistakes like overtrading after losses or abandoning your plan during drawdowns. These behaviors are just as destructive in simulation as they are live, and they are easier to correct when the financial stakes are zero.
When you are ready to transition to live trading, a deliberate transition plan requires starting with smaller position sizes than your simulation results suggest you can handle. The psychological weight of real money changes your execution speed, your willingness to hold through drawdowns, and your ability to follow rules during losing streaks. Reduce your size by 50 to 75 percent initially, demonstrate consistent rule adherence for at least 20 live trades, then scale up incrementally. This approach is grounded in how algorithmic trading strategies are stress-tested before full deployment.
Key takeaways
Simulation is the most reliable method for validating a trading strategy before real capital is at risk, but only when it models realistic execution costs and is used with structured discipline.
| Point | Details |
|---|---|
| Simulation accelerates learning | Replay tools compress months of market exposure into days through candle-by-candle historical practice. |
| Realistic modeling is non-negotiable | Slippage, commissions, liquidity, and look-ahead bias must all be modeled or backtest results are meaningless. |
| Monte Carlo beats single-path testing | Reshuffling trade sequences thousands of times reveals worst-case drawdowns that standard backtests hide. |
| Psychological gap is real | Prop firm simulators with real fees create more realistic pressure than standard paper trading accounts. |
| Transition deliberately | Start live trading at 50 to 75 percent of simulated position size and scale only after consistent rule adherence. |
Why simulation alone never made me a better trader
Backtests can loo exceptional on paper. Win rates above 60 percent, drawdowns that seemed manageable, profit factors that made the strategy look like a machine. Then I went live and watched the same strategy produce results that bore almost no resemblance to the simulation.
The problem was not the strategy. The problem was that I had confused a simulation of my assumptions with a simulation of reality. My fills were idealized. My slippage model was static. I had not accounted for the days when liquidity evaporated and my stop orders became market orders three points away from where I expected. And I had absolutely no preparation for the psychological experience of watching a position move against me when real money was attached to it.
What changed my results was not better software. It was treating simulation as a structured training protocol rather than a performance preview. I started writing game plans before every session, reviewing rule adherence instead of profit and loss, and applying Monte Carlo analysis to understand what my strategy’s realistic worst case actually looked like. The simulation did not make me a better trader. The discipline I brought to the simulation did.
The traders I see struggle most with simulation are the ones who use it to confirm what they already believe. They run a backtest, see a positive result, and call the strategy validated. Real validation means stress-testing across regimes, modeling realistic costs, and then spending deliberate time in replay practice until execution is automatic. Simulation is a prerequisite for live trading. It is not a substitute for the psychological and mechanical work that only live trading ultimately demands.
— Jay
Take your strategy from simulation to automated execution with Tickerly

Once your strategy is validated through simulation and backtesting, the next challenge is executing it with the speed and consistency that live markets require. Tickerly converts your TradingView Pine Script strategies into fully automated trading bots that execute across crypto, forex, and stock exchanges without manual intervention. You can review alert logs, monitor execution quality, and run multiple strategies simultaneously, giving you the same data-driven control in live trading that you built during simulation. If you have spent time optimizing your trading strategies in simulation, Tickerly is the logical next step to deploy them at full speed. Explore the platform at Tickerly and put your validated strategies to work.
FAQ
What is the role of simulation in trading?
Trading simulation replicates live market conditions using real historical or live price data, allowing traders to practice execution, test strategies, and collect performance metrics without risking capital. It serves as the primary validation environment between strategy development and live deployment.
How does trading simulation differ from backtesting?
Backtesting runs a coded strategy automatically over historical data to measure past performance, while a trading simulator requires manual execution in a replayed or live environment. Both are necessary: backtesting tests the logic, simulation tests the trader’s execution of that logic.
Can simulation fully prepare you for live trading?
Simulation builds mechanical fluency and strategy confidence, but it cannot fully replicate the psychological pressure of real capital at risk. Prop firm simulators with real fees come closest, but most traders still experience a performance gap when they first go live.
What metrics should I track in trading simulation?
Track win rate, expectancy, maximum drawdown, profit factor, and average risk-to-reward ratio. These metrics turn subjective trading impressions into data points you can use to refine your strategy before committing real money.
What is Monte Carlo simulation in trading?
Monte Carlo simulation reshuffles your historical trade results thousands of times to generate a probability distribution of outcomes, including worst-case drawdowns at the 95th percentile. It provides far more reliable account sizing guidance than a single historical backtest path.