

Support and resistance (S/R) are price zones where buying or selling pressure repeatedly pauses or reverses price movement. Every serious trader needs to recognize the main support resistance level types before placing a single trade. The primary types are:
-
Horizontal swing highs and lows — the foundational levels every chart shows
-
Trendlines — diagonal S/R connecting sequential swing points
-
Moving averages — dynamic levels that shift with price (20 EMA, 50 SMA, 200 SMA)
-
Fibonacci retracements — key ratios derived from prior swings
-
Pivot levels — session-fixed formula levels including S1, S2, R1, R2
-
Round numbers — psychological price magnets ($100, $50,000, 1.3000)
-
Volume profile / Point of Control (POC) — price nodes where the most volume traded
-
Gaps — unfilled price voids that act as future S/R
-
Order blocks — institutional supply/demand zones from prior impulsive moves
-
All-time highs and lows — extreme historical reference points
The core trading rule: treat every level as a zone, not an exact price. Prioritize levels where multiple types overlap (confluence), and always confirm with volume before committing size.
Key Takeaways
The most reliable S/R trades combine horizontal swing levels from higher timeframes with at least one confirming factor — volume, confluence, or a role-reversal retest.
| Point | Details |
|---|---|
| Horizontal levels come first | Mark weekly and daily swing highs/lows before adding any other S/R type. |
| Treat levels as zones | Use a 0.25–0.5 ATR buffer; require candle closes, not wicks, to confirm breaks. |
| Confluence raises probability | Two overlapping S/R types warrant a trade; three or more justify larger size. |
| Volume confirms the move | A reversal or breakout on heavy volume signals real order flow; low-volume signals are suspect. |
| Tickerly automates execution | Convert your TradingView S/R alerts into live bots that execute bounce and breakout rules without manual intervention. |
Table of Contents
-
How do you trade S/R levels: bounces, breaks, and role reversals?
-
How did support and resistance concepts develop in technical analysis?
What are the main support resistance level types?
Horizontal swing highs and lows are the most reliable S/R types because they are unambiguous and visible to both discretionary traders and algorithms. When price reverses at a level multiple times, that zone is defended by real orders. Start every chart analysis here before adding any other layer.
Horizontal swing highs and lows
Mark the most recent swing high (resistance) and swing low (support) on your working timeframe, then extend those lines to the right. A level gains credibility with each test — two touches are a pattern, three or more make it a high-confidence zone. On a daily chart, look for three clean tests at the same price area. On a 4-hour chart, even two sharp rejections with long wicks signal a defended zone.
Chart example: Three touches at $185 on a daily stock chart, each followed by a multi-day pullback, confirm a horizontal resistance zone. The third test with a bearish engulfing candle is the highest-probability short entry.

Trendlines
A trendline connects at least two swing lows (uptrend support) or two swing highs (downtrend resistance). The more touches, the stronger the line — but a trendline is only as good as its angle. Shallow trendlines under 20 degrees tend to be noise; steep ones above 60 degrees break quickly. For practical trendline drawing in forex, anchor the first point to a significant swing and confirm the second touch before trading it.
Chart example: A rising trendline on a 4-hour EUR/USD chart connecting three higher lows over six weeks; price bounces cleanly off the line each time until a decisive close below it signals a trend break.

Moving averages as dynamic S/R
Moving averages shift with price, making them dynamic rather than static levels. The 20 EMA acts as short-term support in trending markets and is the go-to level for aggressive pullback entries. The 50 SMA is the intermediate-term reference most swing traders watch. The 200 SMA defines the long-term trend regime — a stock trading above it is broadly bullish; below it, broadly bearish. Their reliability depends directly on how many participants follow them, which is why these three specific MAs matter more than arbitrary alternatives.
Fibonacci retracements
After a significant price swing, Fibonacci retracement levels mark the most probable pullback zones. Specific Fibonacci retracement levels commonly watched include some key ratios considered significant by many traders.
Pivot levels: S1, S2, R1, R2
Pivot levels are calculated from the prior session’s high, low, and close using a fixed formula. The central pivot (PP) is the session’s fair value reference. R1 and R2 are resistance levels above it; S1 and S2 are support levels below. These levels remain fixed for the entire trading session, making them reliable intraday reference points that many prop desks and algorithmic traders monitor. A practical catalogue of S/R types confirms that pivots, alongside VWAP and horizontal levels, form the core intraday toolkit.
Chart example: On an S&P 500 futures 15-minute chart, price opens above the daily pivot, pulls back to R1 (now acting as support), and bounces — a textbook pivot-flip entry.
Round numbers and psychological levels
Round numbers attract clustered orders from retail traders, institutional desks, and options market makers. Round numbers and all-time highs/lows act as self-fulfilling S/R because so many participants place orders at those prices. In forex, 1.2000 and 1.2500 on EUR/USD are defended far more aggressively than 1.2137. In crypto, $100,000 on Bitcoin drew months of price consolidation. Always mark the nearest round number to your entry zone — it often explains why a level holds or breaks.
All-time highs and lows
All-time highs are pure resistance because there are no buyers trapped above them. Once price breaks through an ATH with conviction, the prior ATH flips to support. All-time lows work in reverse. These levels carry outsized psychological weight and often trigger algorithmic orders the moment price approaches them.
Gaps
A gap is an unfilled price void between one session’s close and the next session’s open. Gaps on daily charts — particularly earnings gaps in stocks or news-driven gaps in forex — frequently act as S/R. Price tends to “fill” gaps eventually, but in strong trends, gaps can remain open for months. Mark the gap’s upper and lower edges as a zone; the midpoint often acts as a magnet.
Volume profile and Point of Control (POC)
The volume profile shows how much volume traded at each price level over a defined period. The Point of Control is the single price level with the highest traded volume. Price tends to gravitate toward the POC and either consolidate there or reject sharply. VWAP and volume-profile POC are institutional intraday anchors — use the POC for multi-session structural S/R and VWAP for same-session reference.
Order blocks
An order block is a consolidation zone just before a sharp impulsive move, representing where institutional orders were placed. In supply and demand analysis, a supply/demand zone is essentially a refined order block. Mark the last consolidation candle before a strong breakout; when price returns to that zone, it often finds support or resistance as remaining institutional orders get filled.
How do you identify reliable S/R zones on your charts?
The difference between a high-probability S/R zone and random noise comes down to a repeatable identification process. Follow these steps every time you mark a chart.
-
Start on the weekly chart. Mark the two or three most obvious swing highs and lows of the past 52 weeks. These are your highest-conviction levels — they take precedence over everything below.
-
Drop to the daily chart. Add the most recent swing high and low, plus any clear horizontal clusters where price has reversed two or more times. Keep it to five or fewer levels total.
-
Move to the 4-hour chart. Identify the current trend structure and mark the nearest S/R zones within 3–5% of the current price. Add trendlines if a clear trend is in place.
-
Use the 1-hour chart for entry precision. Refine your zone boundaries and look for confirmation signals (pin bars, engulfing candles, volume spikes).
-
Intraday (15-minute or less). Add pivot levels (S1/S2/R1/R2) and VWAP for session context. Do not add new structural levels here — use what the higher timeframes already defined.
Practical charting habits and timeframe hierarchy consistently show that traders who mark too many levels end up paralyzed. Limit yourself to a small number of active levels per timeframe to avoid clutter and confusion.
Turning price points into zones, not lines
S/R should be treated as zones rather than exact prices — wicks through a level are normal, and a decisive close beyond the zone is the cleaner break signal. Use the Average True Range (ATR) to set a sensible zone width. On a daily chart, a buffer of 0.25–0.5 ATR above and below the swing point creates a realistic zone. Use candle closes, not wicks, to define zone boundaries; a wick that pokes through a level but closes back inside it is not a break.
For higher-confidence levels, require two to three tests. A first-test setup is tradable when the context is clean: the level is on a higher timeframe, the approach is orderly, and volume is rising into the zone.
Pro Tip: Mark your zones with a rectangle tool, not a single line. A zone drawn from the body close to the wick extreme gives you a visual buffer and prevents you from treating S/R as a single tick.
How do you trade S/R levels: bounces, breaks, and role reversals?
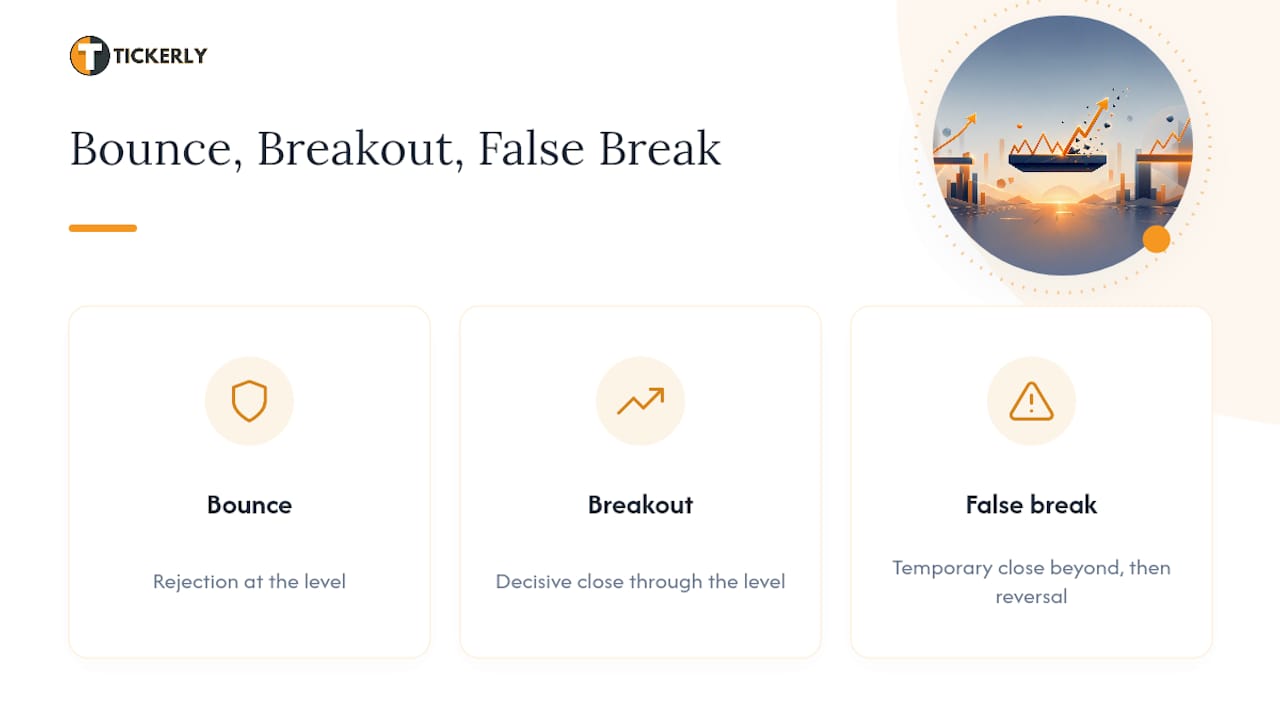
Three behaviors play out at every S/R level: a bounce (rejection), a breakout (decisive close through), or a false break (trap). Professional traders classify every level interaction into one of these three outcomes and adjust their execution accordingly.
Trading the bounce
Buy near support with a stop placed below the zone close, not below the wick. A stop set just under the zone’s lower boundary (plus an ATR buffer) absorbs normal noise without being triggered by a legitimate test. Target the next resistance level or aim for a minimum 2:1 reward-to-risk ratio. Entry triggers that improve timing: a bullish pin bar, a bullish engulfing candle, or a volume spike on the reversal candle. The same logic applies in reverse for shorting resistance.
Trading the breakout
A valid breakout requires a decisive close beyond the zone, not just a wick. Expanding volume on the breakout candle confirms genuine order flow rather than a stop-hunt. Volume acts as a confirmatory filter — a breakout on heavy volume signals real participation; a breakout on thin volume is suspect. Two entry approaches: enter on the breakout candle’s close (aggressive) or wait for a retest of the broken level (conservative). The retest entry offers a tighter stop and better risk-to-reward.
Handling false breakouts
A false breakout occurs when price closes briefly beyond a zone, then reverses back inside. The tell: the breakout candle has a large wick and closes back within the zone, often on declining volume. When you recognize a false break, the trade inverts — the failed breakout itself becomes a signal in the opposite direction. Set your stop above the false-break wick and target the opposite side of the range.
Role reversal (polarity flip)
Old resistance becomes new support, and old support becomes new resistance. This is one of the most reliable setups in technical analysis. A clean flip requires a decisive break of the original level, a pullback to the zone, and a rejection. A sloppy flip — where price grinds through the zone slowly without a clean break — is lower probability and often signals a ranging market rather than a trend continuation. For price action approaches to trading bounces and breaks, the role-reversal retest is among the highest-probability entries available.
Risk management note: More confluence at a level justifies accepting a larger position size or a tighter stop. A level backed by only one S/R type warrants smaller size and a wider stop. Tie your position size directly to the number of confirming factors.
Which indicators create support and resistance levels?
Several indicators generate S/R levels automatically, either as fixed session references or as dynamic price-following bands. Understanding how each one works helps you pick the right tool for your timeframe.
-
Pivot levels (PP, R1, R2, S1, S2). Calculated as: PP = (Prior High + Prior Low + Prior Close) / 3. R1 = (2 × PP) − Prior Low. S1 = (2 × PP) − Prior High. R2 and S2 extend one more step. These levels are fixed for the session, making them ideal for intraday traders who need clean reference points without redrawing levels mid-session.
-
Moving averages (20 EMA, 50 SMA, 200 SMA). Each serves a distinct role. The 20 EMA is the short-term trend filter and pullback entry reference. The 50 SMA is the intermediate swing level. The 200 SMA defines the long-term regime. When price is above all three, the trend is unambiguously bullish; below all three, bearish. For technical indicators that complement S/R, these three MAs are the starting point.
-
VWAP (Volume Weighted Average Price). VWAP resets each session and represents the average price weighted by volume. Institutional desks use it as a benchmark — price above VWAP is bullish intraday; below is bearish. It functions as dynamic S/R throughout the session and is most reliable in liquid markets (equities, futures, major forex pairs).
-
Volume profile / POC. Unlike VWAP, the volume profile POC can span multiple sessions and identifies the price level with the highest traded volume over a custom period. It acts as a structural magnet and is particularly useful for swing traders.
-
Bollinger Bands. The upper and lower bands act as dynamic resistance and support in ranging markets. In trending markets, price can “walk the band” for extended periods, so Bollinger Bands work best as a volatility filter rather than a standalone S/R tool.
-
Ichimoku Cloud. The cloud (Kumo) provides a visible S/R zone with a forward projection. Price above the cloud is bullish; inside the cloud signals indecision; below the cloud is bearish. The cloud’s upper and lower boundaries act as dynamic S/R, and the cloud’s thickness indicates zone strength.
Automation note: Pivot levels, moving average proximity tests, and VWAP crossovers translate cleanly into bot-friendly rules because they produce precise, calculable values. Volume profile POC requires a bit more setup but is increasingly supported by modern algorithmic trading data tools. Bollinger Bands and Ichimoku are straightforward to code as conditional filters in Pine Script.
Why do confluence and volume raise S/R probability?
Confluence means two or more S/R types aligning at the same price zone. Combining static horizontal levels with dynamic moving averages and psychological round numbers creates a zone that is harder for price to penetrate than any single level type alone. The practical consequence: stronger defense on a bounce, and faster continuation when the zone finally breaks.
A simple scoring approach:
-
1 S/R type at a zone: watch only, no trade without additional confirmation
-
2 S/R types overlapping: worth trading with standard size and normal stop placement
-
3+ S/R types overlapping: high-confidence level; accept larger size or tighter stop
Volume is the filter that separates defended levels from coincidental reversals. A reversal at a support zone on low volume often signals exhaustion rather than a durable shift in demand. A reversal on heavy volume — particularly a volume spike two to three times the session average — implies genuine institutional participation.
For volume profile work, the POC is the single most useful confluence anchor. When the POC aligns with a horizontal swing level and a round number, you have three independent reasons to expect a reaction.
Automation note: These filters translate directly into bot logic. Tickerly’s advanced alert signals let you build exactly this kind of multi-condition trigger from TradingView without writing execution code from scratch.
Pro Tip: *Before coding a confluence filter into a bot, backtest it manually on 50 historical setups. Count how many times the zone held vs. broke.
Common S/R mistakes and a pre-trade checklist
Most S/R-based trades fail not because the concept is wrong, but because of execution errors that are entirely avoidable. Here are the five most costly mistakes and a one-line fix for each.
-
Treating S/R as an exact price. Fix: draw a zone using ATR buffer; never place your stop at the exact level.
-
Over-drawing levels. Fix: limit yourself to three to five active levels per timeframe; delete levels that have been clearly broken.
-
Ignoring timeframe hierarchy. Fix: always check the weekly and daily chart before marking intraday levels; higher-timeframe levels override lower-timeframe ones.
-
Ignoring volume. Fix: require a volume confirmation signal (spike or above-average bar) before entering on a bounce or breakout.
-
Chasing breakouts without confirmation. Fix: wait for a retest of the broken level before entering; if no retest comes, skip the trade.
For a deeper look at why S/R-based strategies fail and how to correct them, the patterns above appear repeatedly across all instruments and timeframes.
Pre-trade checklist (copy this before every S/R trade):
-
Timeframe check: Is this level visible on the daily or weekly chart?
-
Confluence check: Do two or more S/R types align at this zone?
-
Volume check: Is volume rising into the zone, or is there a volume spike on the reversal candle?
-
Risk-to-reward check: Is the reward at least 2x the risk to the stop?
-
ATR buffer set: Is the stop placed beyond the zone by at least 0.25 ATR?
Run through all five before sizing into any S/R trade. If two or more checks fail, reduce size or skip entirely.
How did support and resistance concepts develop in technical analysis?
Support and resistance as a formal concept traces back to the early 20th century, when Charles Dow’s writings on market behavior established the idea that price tends to respect prior highs and lows. Dow’s observations about trend structure — higher highs and higher lows in uptrends, lower highs and lower lows in downtrends — implied that prior swing points carry predictive weight, which is the core logic behind horizontal S/R.
Richard Wyckoff expanded on this in the 1910s and 1920s, framing S/R through the lens of supply and demand. His “accumulation” and “distribution” phases described how institutional operators build or unwind positions at specific price zones, leaving behind the order blocks and volume clusters that modern traders still mark today. Wyckoff’s work is the direct ancestor of volume profile analysis and order block theory.
Fibonacci ratios entered technical analysis through the work of Ralph Nelson Elliott in the 1930s, who observed that market waves tended to retrace in proportions consistent with the Fibonacci sequence.
Pivot points emerged from floor trading in the mid-20th century. Floor traders on the Chicago exchanges calculated the prior day’s high, low, and close each morning to derive reference levels for the session ahead. That formula — unchanged in its essentials — is what modern traders call the standard pivot, with S1/S2 and R1/R2 as its derivatives.
The digital era accelerated the adoption of every S/R type. When retail platforms began offering volume profile, VWAP, and automated Fibonacci tools in the 1990s and 2000s, levels that once required manual calculation became universally visible. That visibility is precisely why they work: a level that thousands of traders mark independently becomes a self-fulfilling zone of order concentration.
How to prioritize S/R types in your trading workflow
The most common mistake traders make is treating all S/R types as equal. They are not. Here is how to sequence them.
Start with horizontal swing levels on the weekly and daily charts. These are the levels that have already proven themselves through multiple tests and are visible to the widest audience, including algorithmic systems. Mark them first, every session.
Add moving averages and trendlines next, but only when a clear trend is in place. In a choppy, ranging market, the 20 EMA and trendlines lose their reliability as S/R tools. In a trending market, they are among the most consistent pullback references available.
Use Fibonacci retracements, volume profile POC, and order blocks as confluence layers, not primary levels. Alone, any one of those three is a lower-probability setup.
One adaptation worth noting: in crypto, round numbers and all-time highs carry more weight than in equities because retail participation is proportionally higher. In forex, pivot levels and VWAP are the dominant intraday tools because institutional desks use them as benchmarks. In stocks, the 50 SMA and 200 SMA are the most-watched dynamic levels, and earnings gaps create some of the strongest structural S/R zones on the chart.
Automate your S/R rules with Tickerly
Identifying great S/R levels is only half the work. Executing on them consistently, without hesitation or second-guessing, is where most traders lose the edge they spent hours building on their charts.

Tickerly converts your TradingView S/R-based strategy alerts into fully functional trading bots that execute in real time across crypto, forex, stocks, and futures. The practical benefits for S/R traders are direct: your bounce and breakout rules fire the moment the condition is met, not 30 seconds later when you finally notice the candle. Confluence filters and volume thresholds you define in Pine Script become hard rules the bot enforces on every setup, every session. There is no override, no hesitation, and no missed retest entry because you stepped away from the screen.
For traders ready to move from manual chart-watching to automated bot execution, Tickerly’s 30-day free trial is the lowest-friction way to test whether your S/R rules hold up in live markets. Connect your TradingView alerts, set your exchange API, and let the bot handle execution while you focus on refining your levels.
Sources
This article is general information, not a substitute for advice from a qualified financial advisor. Consult a qualified financial professional about your own circumstances before acting on anything here.
FAQ
What are the main types of support and resistance?
The primary types are horizontal swing highs and lows, trendlines, moving averages (20 EMA, 50 SMA, 200 SMA), Fibonacci retracements, pivot levels (PP, R1, R2, S1, S2), round numbers, volume profile POC, gaps, order blocks, and all-time highs and lows. Most traders prioritize horizontal levels first, then add dynamic and confluence layers.
What is S1, S2, R1, R2 in trading?
S1 and S2 are support levels below the central pivot point (PP), and R1 and R2 are resistance levels above it. All four are calculated from the prior session’s high, low, and close and remain fixed for the current trading session, giving intraday traders clear reference points for entries and stops.
Should you buy a stock at a support level?
Buying at support is a valid strategy, but only with confirmation. Wait for a reversal signal — a bullish pin bar, engulfing candle, or volume spike — before entering. A support level that is also backed by a moving average or pivot level (confluence) and shows rising volume on the bounce offers the highest-probability entry.
How do you identify support and resistance levels?
Start on the weekly chart and mark the two or three most significant swing highs and lows. Drop to the daily chart and add recent horizontal clusters with two or more tests. Use an ATR-based buffer to draw zones rather than exact lines, and require candle closes beyond the zone to confirm a break.
How do you spot a false breakout at a S/R level?
A false breakout typically shows a candle that closes briefly beyond the zone but then reverses back inside, often with a large wick and declining volume. When you identify one, the failed break itself becomes a trade signal in the opposite direction, with a stop above the wick and a target at the far side of the range.