

Most traders look at their account balance at the end of the week and call it a review. If it went up, they feel good. If it went down, they feel bad. That’s not how to evaluate trading results with any real rigor, and it’s exactly why most traders repeat the same mistakes on an endless loop. Assessing trading performance accurately requires a structured framework built on multiple metrics, filtering dimensions, and disciplined review cycles. This guide gives you that framework, from the five core metrics every trader needs to advanced diagnostics that separate genuine edge from statistical noise.
Table of Contents
Key Takeaways
| Point | Details |
|---|---|
| Five metrics beat one | Win rate, profit factor, expectancy, max drawdown, and average R-multiple together reveal your true edge better than any single number. |
| Filter to find your edge | Breaking results down by session, ticker, setup, and holding time shows exactly where your strategy works and where it breaks down. |
| Weekly reviews are optimal | A 30-minute structured review each week balances sufficient data accumulation with timely detection of performance problems. |
| Advanced metrics reduce false confidence | Sharpe ratio, Deflated Sharpe Ratio, MAE, and MFE help you avoid overfitting and diagnose exit quality with precision. |
| Automation cuts evaluation errors | Automated trading tools reduce manual tracking errors and make consistent metric calculation far more reliable. |
How to evaluate trading results with core metrics
Traders often err by relying on total P&L or win rate alone, overlooking drawdowns and risk-adjusted metrics. A strategy can have a 70% win rate and still destroy your account if the average loss is four times the average win. Measuring trading success correctly means looking at a suite of metrics simultaneously.
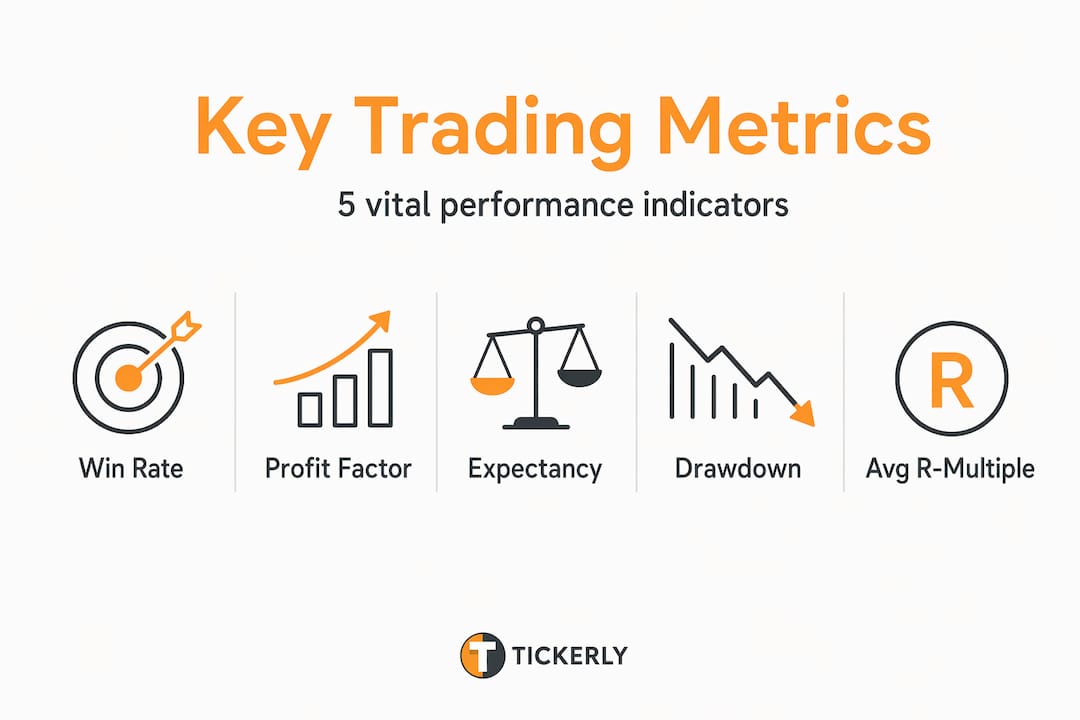
Five core metrics provide a complete picture of trading edge and execution quality when used together:
-
Win rate: The percentage of trades that close profitable. Useful as a baseline but meaningless without context on average win and loss size.
-
Profit factor: Total gross profit divided by total gross loss. A profit factor above 1.3 with an adequate sample of trades indicates net profitability. Anything below 1.0 means you are losing money overall.
-
Expectancy: The average dollar amount you expect to earn per trade, calculated as (Win Rate × Average Win) minus (Loss Rate × Average Loss). When calculating expectancy, match risk sizing to actual defined risk at entry to avoid distorting your statistics with execution costs.
-
Maximum drawdown: The largest peak-to-trough decline in your account equity during the measurement period. High drawdown makes a strategy psychologically untradeable even if the profit factor looks strong.
-
Average R-multiple: The average return expressed as a multiple of the initial risk per trade. An R-multiple above 0.5R per trade signals a healthy reward-to-risk relationship.
Here is a quick reference for interpreting these metrics:
| Metric | Healthy benchmark | Red flag zone |
|---|---|---|
| Win rate | 40–65% (strategy dependent) | Below 35% or above 80% without context |
| Profit factor | Above 1.3 | Below 1.0 |
| Expectancy | Positive and growing | Negative or declining over time |
| Max drawdown | Below 15% of account | Above 25% of account |
| Average R-multiple | Above 0.5R | Below 0R |
Pro Tip: Never use a single metric as a go or no-go signal. A high win rate with a negative average R-multiple is a ticking clock. A low win rate with a strong profit factor can be completely sustainable. The metrics tell a story together.
Filtering your results to find your real edge
Aggregate metrics tell you whether you have an edge. Filtering tells you where that edge exists and where it disappears. Filtering results by session, ticker, and setup exposes exactly which conditions drive your profitability and which are bleeding your account quietly.
The five most useful dimensions for filtering your trade data are:
-
Strategy or setup type: Separate your breakout trades from your mean-reversion trades. Combining them in one data set masks which strategy is actually working.
-
Time of day: Many traders find that trades taken in the first 30 minutes of the market open have completely different expectancy than trades taken mid-session. Calculate your metrics for each time block separately.
-
Day of week: Liquidity and volatility shift meaningfully across the trading week. Some setups work well on Tuesdays and fail on Fridays. You will not know this without filtering by day.
-
Ticker or asset: Your edge in one asset class or instrument may not transfer to another. Run your metrics separately for each ticker you trade with regularity.
-
Holding time: Short-term holds and overnight holds often produce different risk profiles. Segment by average holding period to identify where your exits are well-timed.
Filter-based analysis using one variable at a time avoids misattribution and gives you a clear causal read on what is actually moving your numbers. If you change two variables at once, you cannot tell which one caused the change in performance.
Pro Tip: Avoid stacking multiple filters simultaneously. Combining session, day, and ticker into one filter slice creates sample sizes too small to be statistically meaningful. Work through one dimension at a time, then cross-reference your findings.
For practical tracking, a dedicated trading journal tool or a well-structured spreadsheet with pivot tables works well for this kind of filtering. If you want to go deeper on validating filtered results against historical data, backtesting your trade data is the logical next step.
The weekly review process
A structured weekly review is the engine that converts raw metrics and filters into actual performance improvement. A 30-minute weekly review covering vital signs and filtered metrics is considered best practice for active traders. Daily reviews lack enough data to be meaningful. Monthly reviews are too infrequent to catch deteriorating performance before it does real damage.
Here is a repeatable weekly review process:
-
Record vital signs: Pull your net P&L, win rate, profit factor, expectancy, and maximum drawdown for the week. These five numbers are your dashboard.
-
Compare to your baseline: Set a rolling 12-week average for each metric and compare this week’s numbers against it. A single bad week is noise. A metric moving consistently below its average for three or more weeks is a signal.
-
Run your filters: Apply the five filtering dimensions from the previous section to this week’s trades. Look for setups or sessions that are underperforming their historical averages.
-
Review individual trades: Spend 10 minutes on trades that deviated significantly from your plan, both winners and losers. Identify whether the issue was entry timing, position sizing, or exit management.
-
Document one adjustment: Based on your review, write down one specific change you will test next week. Keep changes small and isolated so you can measure their effect clearly.
The most common review mistake traders make is focusing exclusively on losing trades. Reviewing your winning trades with equal rigor teaches you which conditions produced your best results and which ones you should actively seek out.
Advanced diagnostics and risk-adjusted metrics

Once you have the core five metrics dialed in and a filtering routine established, you can layer in more sophisticated tools to deepen your evaluation. These metrics are not replacements for the fundamentals. They are diagnostic instruments that answer specific questions the core metrics cannot.
Sharpe ratio measures excess return over the risk-free rate divided by the standard deviation of returns. It is a useful screening tool for comparing strategies or time periods at a glance. However, Sharpe ratio can be misleading if your return distribution is not normal, which is common in short-term trading. Use it as a starting filter, not a final verdict.
Deflated Sharpe Ratio (DSR) corrects for the selection bias that appears when you test multiple strategy variations and pick the best performer. DSR adjusts the Sharpe ratio based on the number of trials you ran, reducing false confidence from overfitting. If you have backtested 30 variations of a strategy, the best-performing version almost certainly looks better than it truly is. DSR accounts for this. Applying DSR and conservative interpretation is one of the most underused practices among systematic traders.
Maximum Adverse Excursion (MAE) and Maximum Favorable Excursion (MFE) are trade-level diagnostics that measure maximum adverse and favorable movement within each open trade. MAE tells you how far against you a trade moved before closing. MFE tells you the maximum profit available before the trade closed. If your MFE is consistently much larger than your actual exit profit, your exit strategy is leaving money on the table. If your MAE on losing trades is small and consistent, your entries are directionally sound.
Time-weighted return (TWR) vs. money-weighted return (MWR) matters when you are adding or withdrawing capital during the measurement period. TWR removes cash flow effects, which makes it better for evaluating strategy performance in isolation. MWR reflects the actual dollar return including the impact of your deposit and withdrawal timing, which is more relevant for prop firm accounts or discretionary capital allocations.
| Advanced metric | What it answers | When to use it |
|---|---|---|
| Sharpe ratio | How much return per unit of risk? | Comparing strategies or periods |
| Deflated Sharpe Ratio | Is this Sharpe real or overfitted? | After running multiple backtests |
| MAE | Are entries directionally accurate? | Diagnosing stop placement |
| MFE | Are exits capturing available profit? | Optimizing profit targets |
| TWR vs. MWR | Is strategy or capital timing driving returns? | When deposits/withdrawals occur mid-period |
For traders working on optimizing automated strategies over longer time horizons, combining DSR with MAE and MFE analysis gives you a much cleaner signal on whether an edge is real and whether it is being executed well.
My honest take on performance analysis
I have worked with enough traders to know that the hardest part of evaluating performance is not understanding the metrics. It is the discipline to actually do the review when your results are bad. Every trader finds a way to look at their journal during a winning week. The review gets skipped exactly when it matters most.
In my experience, the traders who genuinely improve over time are not the ones who know the most about Sharpe ratios or R-multiples. They are the ones who show up for their weekly review without exception, write down what they find honestly, and make small, testable adjustments rather than scrapping their whole approach after one difficult stretch.
The biggest misconception I see is treating the weekly review as a judgment session rather than a diagnostic one. Your job during a review is not to decide if you are a good or bad trader. Your job is to find out specifically which conditions and behaviors are costing you money this week, and which ones are generating it.
I also want to be direct about one thing. No metric or journal system replaces the need to understand why you are optimizing your strategies in the first place. Metrics tell you what happened. Your judgment and experience have to explain why. The quantitative and qualitative layers work together. Neither one is enough on its own.
— Jay
Take your evaluation further with Tickerly
Manually tracking five core metrics, running filters across multiple dimensions, and calculating DSR or MAE for every trade takes time. Significant time. The more trades you run, the more error-prone manual tracking becomes.

Tickerly turns your TradingView strategies into fully automated trading bots that execute without the lag, emotion, or calculation errors that come with manual management. When your strategy runs automatically and logs every trade with consistent data, your weekly review becomes a clean analytical process rather than a data-recovery exercise. You spend your time analyzing results, not reconstructing them.
If you are ready to see how automated bots improve trading efficiency and accuracy, Tickerly is built for exactly this workflow. You can also explore common automated trading questions to understand how the evaluation and execution cycle works end-to-end.
FAQ
What metrics should I use to evaluate trading performance?
The five core metrics for assessing trading performance are win rate, profit factor, expectancy, maximum drawdown, and average R-multiple. Used together, they give a complete picture of your edge and execution quality.
How often should I review my trading results?
A weekly review is the optimal frequency. It gives you enough trades for statistical meaning while catching performance issues quickly enough to act on them before they become serious problems.
What is the Deflated Sharpe Ratio?
The Deflated Sharpe Ratio adjusts the standard Sharpe ratio to correct for selection bias when multiple strategy variations are tested. It reduces false confidence from overfitting and provides a more reliable estimate of real-world performance.
How do I use filters to analyze trade outcomes?
Filter your trades by one dimension at a time, such as session, day of week, ticker, or setup type, to identify which conditions produce your best and worst results. Changing one variable at a time gives you a clear causal read without misleading overlaps.
What is the difference between MAE and MFE in trading?
MAE (Maximum Adverse Excursion) measures how far a trade moved against you before closing, while MFE (Maximum Favorable Excursion) measures the maximum profit available before your exit. Together they diagnose whether your losses come from poor entry direction or poor exit timing.