

Manual strategy tuning on TradingView is one of the most time-consuming tasks a serious trader faces. You adjust one parameter, run a backtest, record the result, and repeat. Hundreds of times. The automated strategy tuning process changes that entirely, letting you test thousands of parameter combinations systematically, validate results with statistical rigor, and deploy only the strategies that hold up under real conditions. This guide walks you through every step: what tools you need, how to execute grid searches, how to validate without overfitting, and how to troubleshoot when results look too good to be true.
Table of Contents
Key Takeaways
| Point | Details |
|---|---|
| Automation beats manual testing | Automated tools reduce hours of manual parameter testing to minutes with grid search methods. |
| Overfitting is the primary risk | 89% of backtested strategies fail out-of-sample, making rigorous validation non-negotiable. |
| Walk-Forward Efficiency matters | A WFE above 60% signals that your optimized parameters genuinely generalize to unseen data. |
| Limit parameters to 2 to 4 | Keeping the parameter count low reduces overfitting risk and keeps your search space manageable. |
| Validation before deployment | Out-of-sample testing and parameter stability checks must precede any live or automated execution. |
The automated strategy tuning process explained
Before you touch a single input field, you need a clear picture of what automated strategy tuning actually means and how it differs from what most TradingView traders do by default.
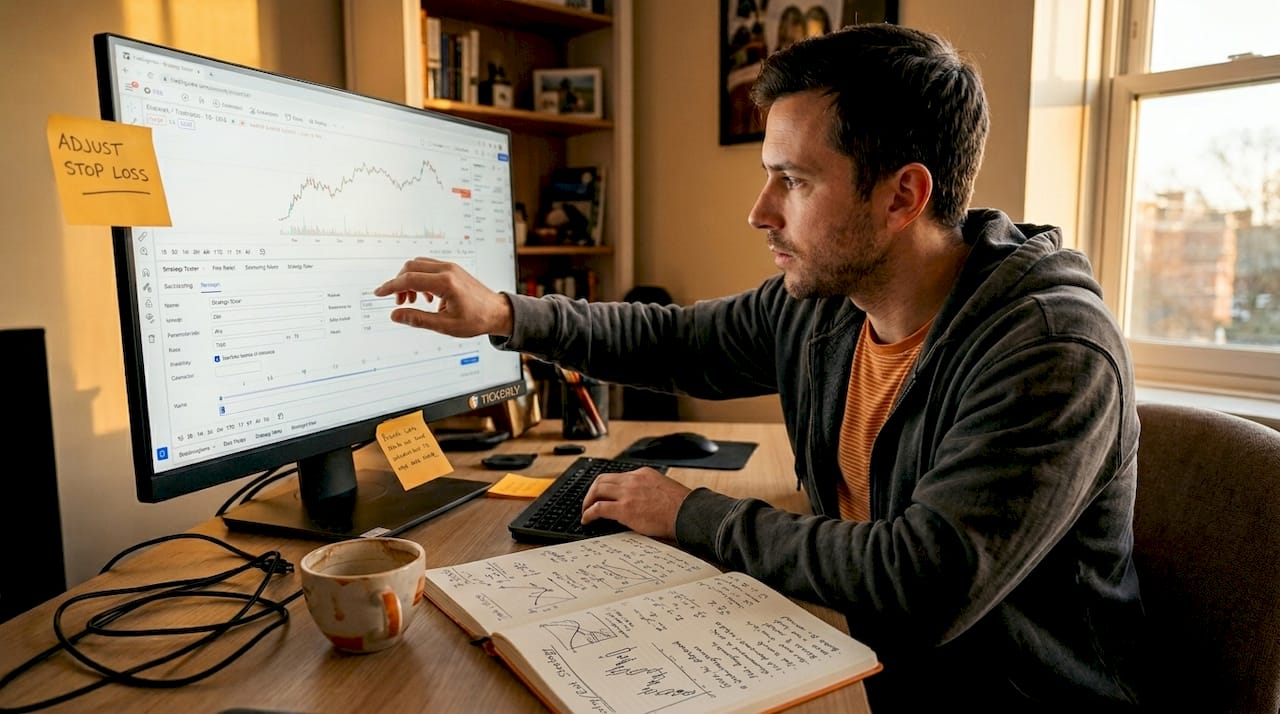
Manual tuning means adjusting one parameter at a time, running a backtest, logging the result, and repeating. It is slow, error-prone, and almost impossible to do at the scale needed to find genuinely robust settings. Automated strategy optimization replaces that loop with a systematic process: you define a range of values for each parameter, and a tool tests every combination within those ranges, records the output metrics, and surfaces the best performers.
TradingView’s built-in strategy tester is powerful for backtesting, but TradingView lacks native automated parameter optimization, meaning every parameter combination requires a manual input change and a fresh backtest run. That limitation is the core problem this guide solves.
Tools you need before you start
Here is a quick reference for the tools and knowledge required to run an effective automated tuning workflow on TradingView:
| Tool / Resource | Purpose | Notes |
|---|---|---|
| TradingView Pro+ or Premium | Access to sufficient historical bars and strategy tester | Free tier is too limited for serious backtesting |
| Pine Script knowledge | Writing and modifying strategy inputs | Focus on "input.int, input.float`, and date filters |
| Pineify or similar optimizer | Automated grid search across parameter ranges | Reduces manual clicks from hundreds to zero |
| Spreadsheet software | Recording and sorting optimization results | Google Sheets or Excel both work well |
| Walk-forward framework | Splitting data into in-sample and out-of-sample periods | Requires date filter setup in Pine Script |
Key prerequisites to have in place before starting:
-
A working Pine Script strategy with clearly defined, adjustable inputs
-
At least 3 to 5 years of historical data on your chosen instrument and timeframe
-
A defined set of evaluation metrics beyond net profit, including Sharpe ratio, maximum drawdown, and profit factor
-
A written hypothesis for why your strategy should work, before you optimize
That last point matters more than most traders realize. Discipline in defining parameter ranges before testing prevents data snooping biases that silently corrupt your results.
Step-by-step execution of automated tuning
With your tools in place, here is how to run the automated strategy tuning process from start to finish.
-
Define your parameter ranges in Pine Script. Open your strategy script and identify every tunable input. For each one, set a minimum, maximum, and step size. Keep your total parameter count to 2 to 4. A disciplined approach limits optimization parameters to this range to reduce overfitting risk and avoid a combinatorial explosion that makes results unmanageable.
-
Set your in-sample date range. Use Pine Script’s
timestamp()function to restrict backtesting to a defined in-sample period. A typical split is 70% of your available data for in-sample testing and 30% reserved for out-of-sample validation. Walk-forward analysis uses rolling windows with this kind of split, repeated multiple times to mimic real trading conditions. -
Run the grid search with an optimizer tool. Load your strategy in TradingView and connect it to Pineify or a comparable tool. Pineify’s optimizer runs automated multi-parameter grid searches, testing hundreds or thousands of combinations and exporting the results with sortable metrics. This step alone can compress what would take days of manual work into minutes.
-
Sort results by multiple metrics, not just profit. Export your results to a spreadsheet. Sort first by Sharpe ratio, then by maximum drawdown, then by profit factor. Net profit alone is a trap. A strategy that returns 200% with a 60% drawdown is not deployable. You want consistent, risk-adjusted performance.
-
Simulate walk-forward analysis using date filters. Once you have candidate parameter sets from the in-sample period, switch your Pine Script date filter to the out-of-sample period. TradingView requires date filtering and manual test cycles to simulate walk-forward testing, since native automated walk-forward is not available. Run each candidate parameter set against the out-of-sample data and record the results.
-
Record everything systematically. Use a spreadsheet with columns for each parameter value, in-sample metrics, and out-of-sample metrics side by side. This structure makes it easy to spot which parameter sets degrade badly out-of-sample, which is the clearest sign of overfitting.
Pro Tip: When setting parameter ranges, avoid ranges that are too wide. If your moving average input spans from 5 to 500 in steps of 5, you are almost certainly going to find a peak that is an artifact of the data, not a real signal. Narrow, hypothesis-driven ranges produce more trustworthy results.
Verification techniques and validation best practices
Finding good in-sample parameters is only half the work. The verification stage is where most traders either protect themselves from bad deployments or skip the step entirely and pay for it later.
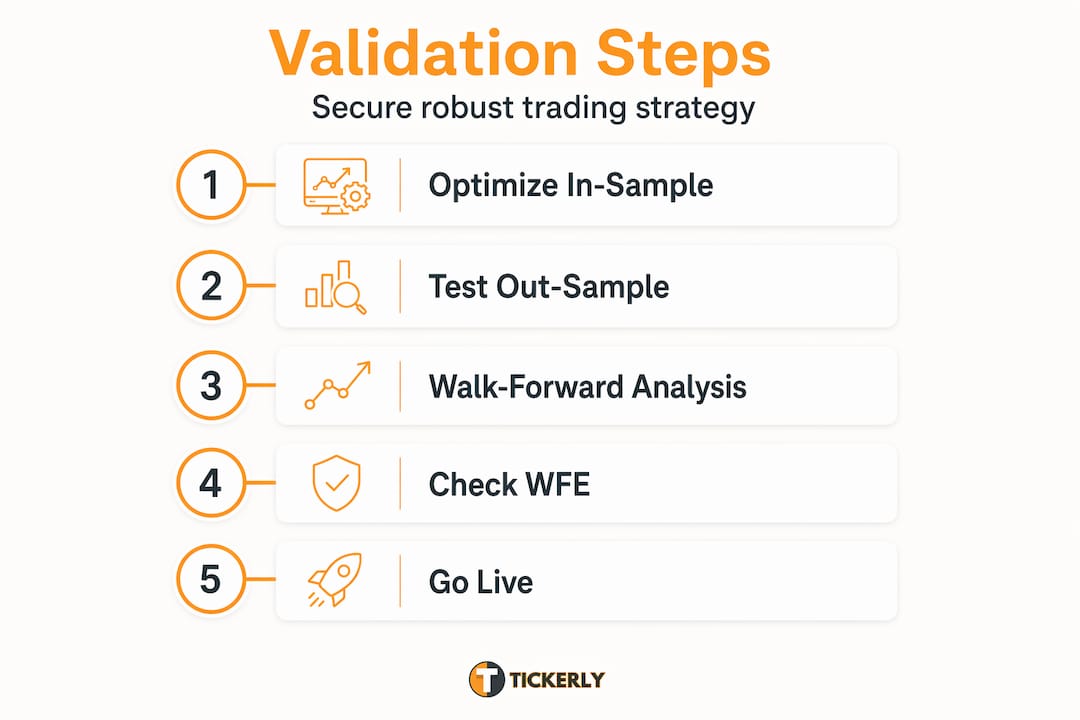
The single most useful metric here is Walk-Forward Efficiency (WFE). The formula is straightforward: divide your out-of-sample return by your in-sample return and multiply by 100. A WFE above 60% indicates strong strategy robustness, while a WFE below 30% is a clear signal of overfitting. If your strategy earns 40% in-sample but only 8% out-of-sample, the parameters are fitted to noise, not to a real market edge.
What good parameters look like
Good parameters form plateaus rather than spikes. This is one of the most underappreciated concepts in strategy fine-tuning techniques. If your optimal moving average length is 47, and performance collapses at 45 and 49, that is a spike. It means the strategy is fragile. If performance stays consistent from 42 to 54, that is a plateau, and it means the parameter is genuinely capturing something real.
Common mistakes to watch for during validation:
-
Overfitting to in-sample data. Your backtest looks exceptional, but the out-of-sample results are flat or negative.
-
Data snooping. You have tested so many variations that you have effectively memorized the historical data.
-
Re-optimizing after losses. Strategies should not be repeatedly re-optimized after losing streaks. Doing so invalidates your out-of-sample test and leads directly to overfitting.
-
Ignoring regime changes. A strategy optimized on a trending 2020 to 2021 market may fail completely in a choppy 2022 to 2023 environment.
Here is a quick comparison of what robust versus fragile tuning results look like:
| Characteristic | Robust strategy | Fragile strategy |
|---|---|---|
| Parameter sensitivity | Stable across a range of values | Collapses with small changes |
| WFE score | Above 60% | Below 30% |
| Out-of-sample behavior | Similar to in-sample | Significantly worse |
| Drawdown consistency | Consistent across periods | Varies wildly |
| Profit factor | Above 1.5 across multiple windows | High in-sample, below 1.0 out-of-sample |
For effective backtesting and out-of-sample validation, the decision rule is simple: if a strategy does not pass walk-forward validation with a WFE above 60% and stable parameter plateaus, it does not get deployed. No exceptions.
Troubleshooting your tuning workflow
Even with the right tools and process, you will run into problems. Here is how to handle the most common ones.
TradingView’s manual burden is real. Without a third-party optimizer, simulating walk-forward analysis by hand is genuinely tedious. If you are doing this manually, batch your test cycles. Run all in-sample tests for a given window before switching to out-of-sample. Mixing the two creates confusion and introduces errors in your records.
Too many parameters kill your results. Every additional parameter you add multiplies your search space and your overfitting risk. If you are tuning more than four parameters simultaneously, stop. Simplify your strategy logic first. A strategy with two well-chosen parameters that works out-of-sample is worth far more than a six-parameter system that looks perfect in backtesting.
When to re-optimize versus when to pause:
-
Re-optimize only when you have a full new out-of-sample window available, not after a single bad week
-
Pause optimization entirely if your strategy’s core logic no longer matches current market conditions
-
Never re-optimize using data that was previously part of your out-of-sample test set
On using AI and machine learning tools responsibly. AI strategy tuning and machine learning tuning processes can accelerate prototyping significantly. But AI and ML tools must be coupled with rigorous validation to avoid curve-fitting. The fact that over 88% of companies use AI in some capacity but only 40% see a positive financial impact tells you everything about the gap between using a tool and using it well.
Pro Tip: Set a calendar reminder to review your strategy’s live performance against its out-of-sample benchmark every 30 days. If live performance diverges significantly from what walk-forward testing predicted, that is your signal to investigate, not to immediately re-optimize.
For a broader look at automating your TradingView workflow, including how to connect validated strategies to live execution, the infrastructure matters as much as the tuning process itself.
My honest take on automated tuning
I have spent years watching traders fall into the same trap. They discover automated optimization, run a grid search, find a parameter set with a 300% backtest return, and deploy it immediately. Two months later, the strategy is down 40% and they blame the tool.
The tool was not the problem. The process was.
What I have learned is that the automated strategy tuning process is only as good as the validation framework around it. Automation handles the mechanical work of testing combinations. It does not think for you. It does not tell you whether your strategy has a real edge or whether you have just found the best way to memorize five years of price history.
Manual tuning, for all its inefficiency, forces you to engage with each parameter decision deliberately. That deliberateness is worth preserving even when you automate. Define your ranges before you run a single test. Write down your hypothesis. Commit to your validation criteria before you see the results.
My prediction is that AI strategy tuning tools will become significantly more capable over the next few years, with real-time strategy adaptation and dynamic strategy adjustment built into platforms directly. But the traders who benefit most will be the ones who understand what the tools are actually doing, not the ones who treat them as black boxes.
Keep your strategy logic simple. Keep your parameter count low. Validate ruthlessly. And never deploy a strategy that has not survived a genuine out-of-sample test.
— Jay
Take your validated strategy live with Tickerly
Once your strategy has passed walk-forward validation and you are confident in its parameter stability, the next challenge is execution. A well-tuned strategy sitting idle in TradingView is not generating returns.

Tickerly turns your TradingView strategies into a fully automated trading bot, handling execution the moment your Pine Script signals fire. No manual order entry, no missed trades due to latency, no emotional interference at the moment of execution. You get the full benefit of your automated strategy optimization work without the friction of manual trading.
Whether you are running trend-following systems or mean-reversion setups, Tickerly connects directly to your broker via API and executes with precision. Explore top TradingView strategies already optimized for automation, or learn more about why automated bots consistently outperform manual execution on validated strategies.
FAQ
What is an automated strategy tuning process?
An automated strategy tuning process systematically tests multiple parameter combinations for a trading strategy using tools like grid search, replacing manual one-at-a-time testing. The goal is to find parameter sets that perform well both in-sample and out-of-sample.
Does TradingView support automated parameter optimization natively?
No. TradingView does not include native automated parameter optimization. Traders must use third-party tools like Pineify or manually adjust inputs and re-run backtests, which is time-consuming for large parameter ranges.
How do I avoid overfitting during strategy tuning?
Limit your optimization to 2 to 4 parameters, use out-of-sample testing with a 70/30 data split, and look for parameter plateaus rather than performance spikes. A Walk-Forward Efficiency score above 60% is a reliable indicator of a robust, non-overfitted strategy.
When should I re-optimize a live strategy?
Re-optimize only when a full new out-of-sample data window is available, not after a short losing streak. Re-optimizing after every poor result contaminates your out-of-sample data and produces parameters that are fitted to recent noise rather than durable market behavior.
Can AI tools replace manual judgment in strategy tuning?
AI and machine learning tuning processes can speed up prototyping and surface patterns faster than manual methods. However, they must be paired with rigorous walk-forward validation. The quality of your strategy logic and validation framework matters more than the sophistication of the optimization tool you use.