

TL;DR:
- Quantitative strategies systematically exploit documented return sources like risk premia and behavioral biases while avoiding emotional trading errors. They rely on diversification, disciplined execution, and rigorous backtesting to confirm genuine edges, especially in volatile markets. While they offer modest but consistent alpha, proper validation and cost management are essential for individual traders to succeed.
Quantitative strategies work because they systematically harvest documented sources of return, including risk premia and behavioral mispricings, while removing the emotional, ad-hoc decisions that erode performance in discretionary trading. Peer-reviewed research in European Financial Management estimates that quantitative hedge funds generate up to ~72 basis points of annual alpha over qualitative funds after controlling for standard risk factors. Firms like AQR and Goldman Sachs have built entire investment platforms on this foundation.
The three mechanisms that make this possible:
- Risk premia and behavioral mispricings: Quant models capture compensation for bearing priced risk and exploit persistent over- and underreaction patterns in market participants.
- Signal extraction and diversification: Statistical models identify repeatable edges across many securities and aggregate them into portfolios where uncorrelated bets reduce noise.
- Disciplined execution and cost management: Automation enforces rules without hesitation, controls transaction costs, and scales monitoring across hundreds of positions simultaneously.
The sections below unpack each mechanism, the empirical evidence behind it, the implementation steps, and the failure modes you need to watch for.
Table of Contents
- Why quantitative strategies work: the core statistical mechanisms
- How backtesting and out-of-sample validation prove a real edge
- Execution and implementation: where theoretical edges meet real markets
- When quantitative strategies fail: the main risks you need to manage
- What the empirical evidence actually shows
- How to evaluate any quantitative strategy before committing capital
- A practical example: from idea to live strategy with Tickerly
- Key Takeaways
- The realistic role of quant strategies in a practitioner’s portfolio
- Tickerly turns validated strategies into live, automated execution
- Useful sources
- FAQ
Why quantitative strategies work: the core statistical mechanisms
The fundamental logic of a quantitative strategy is straightforward: generate a signal, convert it to a position size, and repeat across enough independent bets that the expected edge compounds over time. In notation: Expected Return = Signal Strength × Position Weight × Edge per Bet. No single trade needs to be right. The strategy needs a positive expected value across many trades.
Two primary drivers produce that expected value:
- Rational risk premia: Markets compensate investors for bearing systematic risks, such as value, momentum, carry, and low-volatility factors. These premia are persistent because they reflect genuine economic risk, not arbitrage opportunities that disappear once discovered.
- Systematic behavioral mispricings: Human traders consistently over- and underreact to news, anchor to irrelevant price levels, and sell winners too early. Rule-based models exploit persistent patterns across assets and time horizons that discretionary traders cannot consistently capture.
Signal extraction works through two complementary approaches. Cross-sectional models rank securities against each other at a point in time (e.g., which stocks have the strongest momentum relative to peers). Time-series models evaluate a single security against its own history (e.g., whether a currency pair is trending). Factor models combining value and momentum signals have shown persistent return premia in academic literature spanning decades.
Diversification is where the statistical game really pays off. AQR’s research frames quant management as deliberately playing many small, uncorrelated bets rather than concentrating in high-conviction single names. When signals are genuinely uncorrelated, portfolio volatility falls faster than expected return, pushing the Sharpe ratio higher. The practical implication: a strategy with a modest edge on any single trade can produce a strong risk-adjusted return at the portfolio level.

Pro Tip: Equal-dollar diversification is not the same as equal-risk diversification. Volatility-weighted sizing, where each position’s dollar size is inversely proportional to its recent volatility, ensures that no single high-volatility asset dominates portfolio risk. Risk parity approaches take this further by equalizing risk contributions across asset classes, not just individual positions.
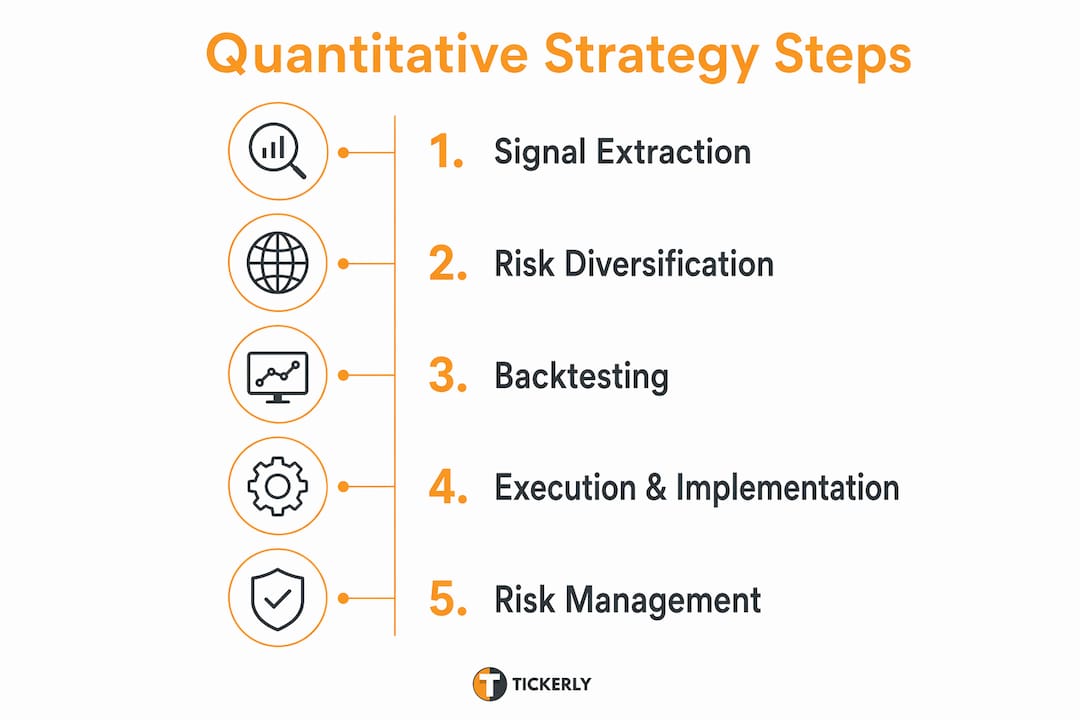
How backtesting and out-of-sample validation prove a real edge
A backtest is not proof of an edge. It is a hypothesis test, and like any hypothesis test, it can be wrong. The validation process that separates real edges from statistical artifacts follows a clear sequence:
- State the hypothesis first. Define the signal, the entry/exit rules, and the expected mechanism before touching data. Post-hoc rationalization of patterns is the root cause of most overfitting.
- In-sample backtest. Fit the model on a defined historical window. Note performance, but treat it as preliminary.
- Holdout/out-of-sample test. Reserve a period the model never saw during development. Performance here is far more predictive of live results.
- Walk-forward analysis. Roll the in-sample window forward in time, re-fitting the model at each step and testing on the next unseen period. This mimics live deployment and reveals parameter instability.
- Robustness checks. Vary parameters by ±10–20% and confirm performance does not collapse. A strategy that only works with one precise parameter setting is almost certainly overfit.
Common statistical traps that inflate backtest results include data-snooping and look-ahead bias, multiple-hypothesis testing without correction, and survivorship bias in the data universe. Each one makes a strategy look better in history than it will ever perform live. A practical backtesting guide for retail traders covers these pitfalls in detail and is worth reviewing before you finalize any model.
Red flag: If a strategy’s backtest performance is concentrated in a single short period, or if Sharpe ratio drops sharply when you shift the start date by three months, the edge is almost certainly a statistical artifact. Genuine edges tend to be consistent across sub-periods and parameter ranges, not dependent on one lucky window.
Your testing checklist should include: realistic bid-ask spread modeling, per-trade commission estimates, slippage assumptions based on average daily volume, borrowing costs for short positions, and a minimum sample of at least 200 independent trades to achieve statistical significance.
Execution and implementation: where theoretical edges meet real markets
A model that works on paper can fail in live trading if execution is poor. The pipeline from signal to filled order has five stages, each of which can erode returns:
- Signal generation: Real-time data feeds, clean and timestamped, with no look-ahead contamination.
- Pre-trade sizing: Apply volatility-weighted or risk-parity sizing rules before order submission.
- Order slicing: Break large orders into smaller child orders to reduce market impact, especially in less liquid instruments.
- Venue selection: Route orders to the exchange or dark pool with the best available liquidity for the instrument.
- Post-trade reconciliation: Compare filled prices against the signal price to measure actual slippage and feed that data back into cost models.
| Cost Factor | What It Is | How It Erodes Returns |
|---|---|---|
| Explicit commissions | Broker fees per trade | Direct deduction from gross P&L |
| Bid-ask spread | Cost of crossing the market | Paid on every entry and exit |
| Market impact | Price moves against you as you fill | Grows with order size relative to volume |
| Slippage | Difference between signal price and fill price | Worsens in fast or illiquid markets |
| Borrowing costs | Fee to hold short positions overnight | Compounds daily on leveraged short books |
Technology requirements are not optional. Data quality and infrastructure are core advantages for quantitative managers, and the gap between institutional and retail infrastructure has narrowed significantly as algorithmic trading trends have made real-time feeds and automated execution accessible to individual traders. You need clean historical data, a reliable real-time feed, order routing with confirmed latency benchmarks, and monitoring systems that alert you when a strategy deviates from expected behavior.
Pro Tip: Before scaling any strategy, calculate its break-even cost per trade: divide expected annual alpha by projected annual turnover. If realistic spread and commission estimates exceed that number, the strategy is not profitable at your account size. Many momentum strategies that work at $10M+ AUM fail below $100K because market impact consumes the entire edge.

When quantitative strategies fail: the main risks you need to manage
No approach is immune to failure, and quant strategies have specific, well-documented failure modes:
- Model overfitting: The strategy was fit too tightly to historical noise. Mitigation: walk-forward testing, parameter stability checks, and ensembling across multiple model variants.
- Regime change: The structural relationship the model exploits shifts, often permanently. Mitigation: adaptive models that re-estimate parameters on rolling windows, plus regular re-testing against recent data.
- Crowding: When many managers run similar signals, the trade becomes crowded. Forced deleveraging by one manager can cascade. Mitigation: monitor position concentration, track factor crowding metrics, and set position limits relative to average daily volume.
- Data-quality failures: Corrupt or delayed data produces false signals. Mitigation: data validation pipelines, anomaly detection, and circuit breakers that halt trading when data quality falls below threshold.
- Execution breakdowns: API failures, exchange outages, or latency spikes cause fills at prices far from the signal. Mitigation: automated kill-switches, position reconciliation checks, and pre-defined maximum drawdown stops.
A strategy that persists even when widely known typically does so because it targets genuine risk compensation or deep behavioral biases. But crowding from identical financing and leverage can still create fragile conditions, as the August 2007 quant deleveraging event demonstrated. Watch for sudden correlation spikes between previously uncorrelated signals, return distributions that shift from normal to fat-tailed, and a sharp decline in the breadth of profitable signals across your universe.
What the empirical evidence actually shows
The research base for quantitative strategies is substantial, though the effect sizes are more modest than marketing materials often suggest:
- Peer-reviewed research in European Financial Management finds quantitative hedge funds outperform qualitative funds by up to ~72 basis points annually on a risk-adjusted basis, a meaningful but not enormous edge.
- AQR’s published research documents persistent factor premia across value, momentum, carry, and defensive factors spanning multiple decades and geographies.
- Goldman Sachs notes that quant approaches excel when market dispersion is high and cross-asset correlations fall, conditions that widen the opportunity set for relative-value signals.
- iCapital’s analysis shows quant strategies tend to perform well in volatile, high-dispersion environments because models can isolate relative performance differences that discretionary managers struggle to process at scale.
For an individual trader or small quant team, the practical implication is this: the ~72 basis points figure applies to institutional funds with diversified signal libraries and low execution costs. At smaller scale, transaction costs consume a larger share of gross alpha, which means your edge needs to be larger per trade, your turnover needs to be lower, or both. Persistence of factor premia is real, but capturing it net of costs requires disciplined cost modeling from day one.
How to evaluate any quantitative strategy before committing capital
Use this checklist before allocating to any strategy, whether your own model or a third-party provider:
Hypothesis and methodology:
- Is the signal hypothesis stated before the backtest, with a clear economic or behavioral rationale?
- Is the backtest methodology fully transparent, including data source, universe, and cost assumptions?
- Is there a genuine out-of-sample period, and does performance hold up there?
- Has walk-forward analysis been conducted across multiple time windows?
- Are results stable across ±20% parameter variations?
Performance and risk:
6. What is the Sharpe ratio and maximum drawdown across different market regimes, not just the full sample?
7. Is performance concentrated in one short period or broadly distributed?
8. What is the turnover, and have realistic transaction costs been modeled?
Governance and trust signals:
- Reproducible code or documented rules that a second person can replicate independently.
- Audited or independently verified backtest logs, not just a chart.
- A defined process for model updates, including who approves changes and how they are documented. Documenting your strategy rigorously is one of the most underrated governance steps in systematic trading.
- Post-trade execution logs showing actual fill prices versus signal prices.
Ask providers directly: “How was the signal discovered, and was the out-of-sample test conducted on data the model never touched?” A provider who cannot answer that question clearly has not done the work.
Historical performance matters less than robustness and explainability. A strategy with a lower Sharpe ratio but stable performance across regimes and parameter ranges is more trustworthy than one with a spectacular backtest that only works under specific conditions.
A practical example: from idea to live strategy with Tickerly
Consider a simple momentum strategy on a liquid equity ETF. The process looks like this: you define the signal (12-month price return, rebalanced monthly), state the hypothesis (assets with strong recent performance tend to continue outperforming over the next 1–3 months), run an in-sample backtest on 2010–2018 data, then test out-of-sample on 2019–2023 data. You model realistic costs: a 0.05% round-trip spread, 0.01% commission, and 0.10% slippage on rebalance days. If the strategy survives that cost model with a positive Sharpe ratio in the out-of-sample period, it is a candidate for automation.
At that point, Tickerly converts the TradingView Pine Script signal into a live execution bot, connecting directly to your exchange via API with low-latency order routing. Because Tickerly handles multiple strategies simultaneously, you can run a momentum signal alongside a mean-reversion signal on a different asset class, achieving the uncorrelated diversification that improves risk-adjusted returns at the portfolio level. The platform’s real-time alerts flag execution anomalies the moment they occur.
Governance tasks to maintain after going live:
- Document every rule change with a date, rationale, and expected impact.
- Re-test the strategy against the most recent 12 months of data every quarter.
- Set a maximum drawdown stop at a pre-defined level (e.g., 15% from peak) that triggers an automatic pause.
- Log every trade with entry price, fill price, and slippage for ongoing cost model calibration.
Pro Tip: Build an automated kill-switch into your execution setup from day one. Define the exact condition (e.g., daily loss exceeds 3% of account equity) and configure your bot to halt all new orders automatically. Manual intervention during a fast-moving drawdown is slow and emotionally compromised. The kill-switch removes that dependency entirely.
Key Takeaways
Quantitative strategies deliver repeatable, risk-adjusted returns by combining systematic signal extraction, disciplined diversification, and rigorous cost-aware execution. Peer-reviewed research estimates that quant hedge funds generate up to ~72 basis points more annual alpha than qualitative funds, but capturing this edge net of cost requires disciplined execution and risk control.
| Point | Details |
|---|---|
| Alpha is real but modest | Peer-reviewed research estimates quant hedge funds generate up to ~72 basis points in annual alpha vs. qualitative funds; net-of-cost capture requires disciplined execution. |
| Diversification drives Sharpe | Aggregating many uncorrelated, volatility-weighted signals reduces noise and raises risk-adjusted returns more than any single signal can. |
| Out-of-sample testing is non-negotiable | Walk-forward analysis and parameter stability checks separate genuine edges from overfitted historical artifacts. |
| Execution costs determine viability | Model realistic spread, slippage, and market impact before scaling; many strategies fail below a minimum account size. |
| Tickerly automates the full pipeline | Tickerly converts validated TradingView signals into live bots with multi-strategy handling, real-time alerts, and exchange connectivity. |
The realistic role of quant strategies in a practitioner’s portfolio
The strongest argument for systematic trading is not that it always wins. It is that it wins consistently enough to compound, and it does so without the behavioral drag that quietly destroys discretionary returns over time. The psychology of discretionary trading is well-documented: loss aversion, recency bias, and overconfidence are not character flaws you can simply decide to overcome. Rules-based systems remove those failure modes structurally.
Where I would urge caution is in the gap between institutional quant and retail quant. The ~72 basis points alpha figure comes from hedge funds with diversified signal libraries, institutional data, and sub-millisecond execution. A retail trader running a single momentum strategy on one asset class is not playing the same statistical game. The edge is thinner, the costs are proportionally higher, and the sample size needed to confirm statistical significance is larger than most traders realize. That does not mean systematic trading is out of reach for individual traders. It means the bar for validation needs to be higher, not lower, and governance (documenting rules, re-testing quarterly, logging every trade) is not optional overhead. It is what separates a real strategy from a lucky backtest.
Tickerly turns validated strategies into live, automated execution
Once you have a strategy that clears the validation checklist above, the next challenge is execution speed and consistency. Manual execution introduces latency, missed signals, and the emotional interference that systematic rules are designed to eliminate.

Tickerly automates the full journey from TradingView signal to live order, connecting to major crypto, forex, and stock exchanges via API with execution speed designed to capture fleeting market opportunities. You can run multiple validated strategies simultaneously, which means the uncorrelated diversification the research supports is not just theoretical. It is operational. Real-time alerts and post-trade logs give you the monitoring layer every systematic trader needs to catch execution anomalies before they compound.
If you are ready to put a validated, rules-based strategy to work, explore automated trading with Tickerly or review the complete guide to TradingView automation to see how your signals translate into live execution.
Useful sources
The following sources were cited in this article and are worth consulting for deeper study:
- The Impact of Quantitative Methods on Hedge Fund Performance (Wiley/EUFM): Peer-reviewed study quantifying the ~72 bps alpha advantage of quant funds; the primary empirical anchor for performance claims.
- The Past and Future of Quantitative Asset Management (AQR): AQR’s foundational paper on diversification, factor premia, and the statistical game framework; essential reading for portfolio construction.
- Quant Investing: Why It Matters (Goldman Sachs): Industry perspective on data advantages, dispersion environments, and the two primary return drivers; useful for understanding institutional implementation.
- How Can a Strategy Still Work If Everyone Knows About It? (AQR): Addresses persistence of factor premia and crowding risk; directly relevant to the risks section.
- The Benefits of Quantitative Investing in a Volatile Market (iCapital): Practitioner analysis of when quant strategies have the strongest edge; useful for timing and regime analysis.
- Quant Strategies: Practical Pitfalls (Investopedia): Accessible overview of overfitting, look-ahead bias, and transaction cost traps; a good starting checklist for retail quants.
- Advantages of a Quantitative Approach (QuantManagement): White paper on rules-based investing, emotional discipline, and cost scaling; useful for framing the behavioral case for systematic trading.
Start with the Wiley study and the AQR diversification paper. Together they give you the empirical foundation and the portfolio construction logic that underpin every other claim in this article. Use them as the benchmark when evaluating any strategy’s reported performance.
FAQ
What makes quantitative strategies more effective than discretionary trading?
Quantitative strategies enforce consistent rules across every trade, eliminating emotional biases like loss aversion and recency bias that systematically erode discretionary returns. They also scale signal monitoring across hundreds of securities simultaneously, something no individual trader can replicate manually.
How much alpha do quantitative hedge funds actually generate?
Peer-reviewed research in European Financial Management estimates quantitative hedge funds generate up to ~72 basis points of annual alpha over qualitative hedge funds after controlling for standard risk factors. Retail traders often face higher costs that reduce net capture.
What is the biggest risk in quantitative strategy development?
Model overfitting is the single most common failure mode: a strategy fit too tightly to historical data produces strong backtests but poor live results. Walk-forward testing and parameter stability checks are the primary defenses.
How does Tickerly support quantitative strategy implementation?
Tickerly automates TradingView Pine Script signals into live execution bots with low-latency API connectivity to major exchanges, handles multiple strategies simultaneously for diversification, and provides real-time alerts for execution monitoring.
When do quantitative strategies perform best?
According to Goldman Sachs and iCapital research, quant strategies tend to perform best in high-dispersion, low-correlation environments where the performance gap between individual securities widens and relative-value signals have the most room to work.