

Countless traders have experienced the same frustration: a strategy that looks flawless on historical data falls apart the moment it meets real market conditions. The win rate drops, drawdowns deepen, and the confidence that came from impressive in-sample results evaporates fast. This pattern is not bad luck. It is the predictable result of insufficient backtesting and validation. When you take a disciplined, structured approach to backtesting using TradingView tools, you give your strategies a genuine stress test before any real capital is at risk. This guide walks you through exactly how to do that.
Table of Contents
- Why backtesting matters: Avoiding common pitfalls
- What you need to backtest effectively
- Step-by-step backtesting workflow
- Interpreting backtest results: What to look for
- What most traders get wrong about backtesting
- Automate and optimize your backtested strategies with Tickerly
- Frequently asked questions
Key Takeaways
| Point | Details |
|---|---|
| Always test out-of-sample | Rely on walk-forward analysis to confirm a strategy’s real robustness. |
| Choose tools wisely | TradingView and platform libraries make backtesting accessible and reliable. |
| Focus on validation, not perfection | Scientific hypothesis testing prevents curve fitting and improves long-term results. |
| Analyze meaningful metrics | Prioritize drawdown, Sharpe ratio, and real-world consistency. |
Why backtesting matters: Avoiding common pitfalls
Backtesting is not just about confirming that your strategy worked in the past. It is about learning whether your strategy has a genuine, repeatable edge or whether you have accidentally built a model that describes history rather than predicts the future. The difference matters enormously, especially when real money is involved.
When traders rush to optimize trading strategies without a structured validation process, they tend to repeat the same costly mistakes:
- Curve fitting: Tweaking parameters until the historical results look perfect, which produces a model that is tailored to past noise rather than actual market behavior.
- Ignoring out-of-sample data: Testing only on the data used to build the strategy, which guarantees the results will flatter the model.
- Skipping walk-forward analysis: Failing to simulate how the strategy would have performed in sequential, unseen time periods.
- Survivorship bias: Only testing on assets or periods that are known to have produced good returns, which skews results upward.
- Overlooking transaction costs: Ignoring slippage, commissions, and spread, which can erase paper profits in live trading.
Each of these errors has the same root cause: treating backtesting as a search for good-looking numbers rather than as a rigorous scientific process.
“Treat the backtest as hypothesis testing: aim to falsify and then validate out-of-sample/walk-forward rather than iterating until the in-sample results look good.” Omar Ora, Quantitative Finance
This reframing is critical. You are not trying to prove your strategy works. You are trying to find every possible way it could fail. If the strategy survives that process, you have something worth deploying.
Pro Tip: Before you touch a single optimization parameter, write down your strategy’s core hypothesis in plain language. For example: “When the 9-period EMA crosses above the 21-period EMA during high-volume sessions, price tends to continue upward over the next 5 bars.” If you cannot state it clearly, you cannot test it rigorously.
Now that we have established the risks, let’s examine what you’ll need to set up a proper backtest.
What you need to backtest effectively
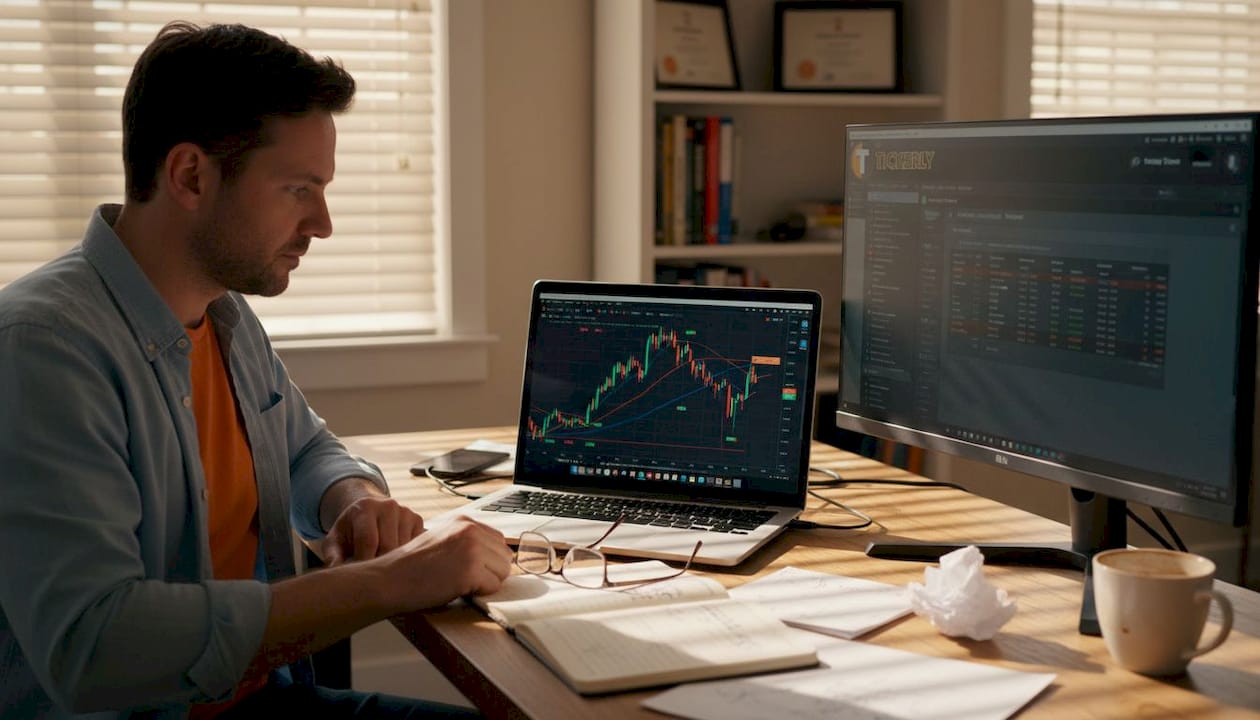
A solid backtest requires more than a strategy idea and a chart. You need the right tools, reliable data, and clearly defined rules before you run a single simulation. Cutting corners at this stage almost always produces misleading results.
Here is what you need to have in place before you start:
- A TradingView account with access to sufficient historical data. Premium plans give you deeper historical bars, which is essential for testing across multiple market cycles.
- A well-defined Pine Script strategy. Your TradingView script should specify precise entry conditions, exit rules, stop-loss placement, and position sizing. Vague conditions produce vague results.
- High-quality market data. The accuracy of your backtest depends entirely on the integrity of the data you feed it. Use adjusted data where splits or dividends apply. For crypto, confirm the exchange data source matches your intended execution venue.
- A documented strategy specification. Write out every rule before testing. This prevents you from unconsciously adjusting rules after seeing results, which is a subtle form of curve fitting.
- A risk management framework. Define your maximum drawdown tolerance, position size as a percentage of equity, and your risk-to-reward targets upfront.
The table below summarizes the core tools and their functions in a TradingView backtesting workflow:
| Tool | Function | Why it matters | |
|---|---|---|---|
| TradingView Pine Script | Strategy scripting and execution | Automates rule-based entry and exit logic | |
| Strategy Tester (built-in) | Runs backtests and reports metrics | Generates performance summary and trade log | |
| Historical data feed | Provides price and volume data | Accuracy determines result reliability | |
| Alert system | Sends signals to external bots | Bridges backtested logic to live automation | |
A review of popular backtesting platforms consistently shows that TradingView’s built-in Strategy Tester is one of the most accessible and powerful tools available for retail traders. It provides a detailed performance summary, equity curve visualization, trade-by-trade logs, and real-time parameter adjustment without requiring external infrastructure.
Understanding the full capabilities of TradingView goes beyond just the Strategy Tester. Exploring TradingView automation insights reveals how the platform’s alert infrastructure can connect your backtested strategy directly to automated execution, closing the loop between testing and real-world deployment.
With your toolkit ready, let’s break down the step-by-step process to ensure your backtest is both rigorous and practical.
Step-by-step backtesting workflow
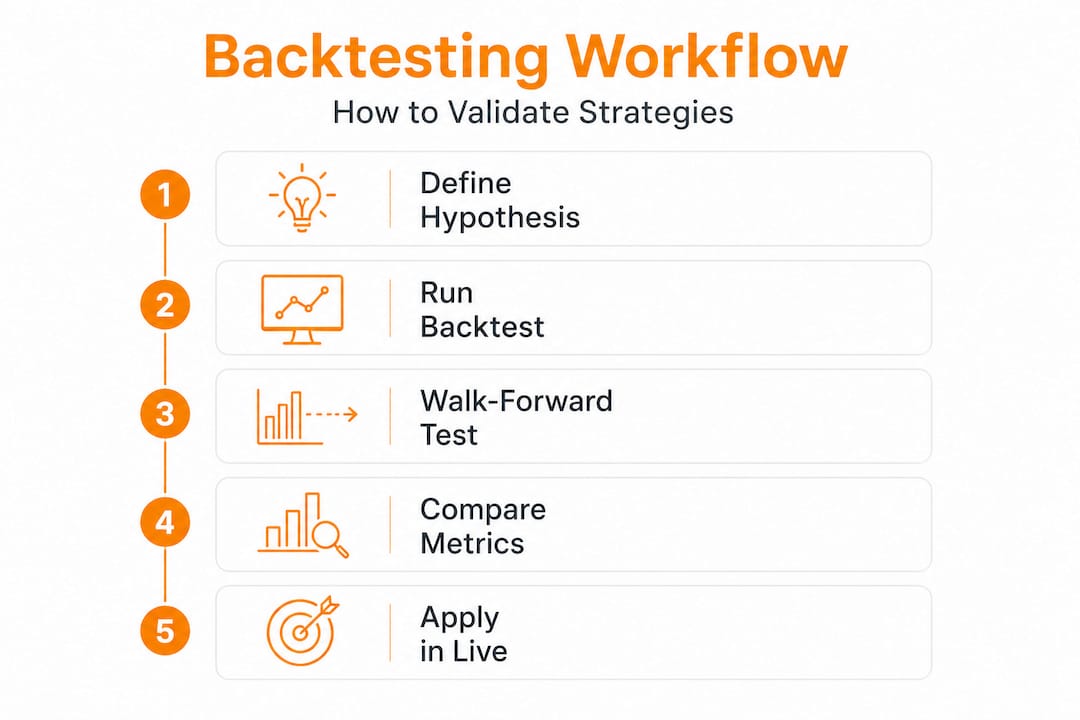
A disciplined workflow separates traders who consistently improve their strategies from those who spend months chasing phantom results. Follow this process in sequence. Skipping steps undermines the entire exercise.
- Define your strategy hypothesis clearly. State what market condition your strategy exploits, which instruments it applies to, and what time frame it targets. This hypothesis governs every decision that follows.
- Write and lock your Pine Script logic. Code your entry signals, exit conditions, stop-loss levels, take-profit targets, and position sizing rules. Lock the script before backtesting begins. Do not modify the logic based on early results.
- Split your data into in-sample and out-of-sample periods. A common approach is to reserve 70% of historical data for in-sample testing and hold back 30% as untouched out-of-sample data. The out-of-sample data should not be examined until you have finalized your in-sample optimization.
- Run the initial backtest on in-sample data. Use TradingView’s Strategy Tester to generate performance metrics. Record the results without drawing conclusions yet.
- Identify parameters for optimization. Select a small number of variables to adjust, such as indicator periods or risk-reward ratios. Optimize these within a reasonable range using logical increments. Avoid over-optimizing.
- Run walk-forward analysis. Walk-forward testing simulates forward-looking performance by repeatedly re-optimizing on a rolling in-sample window and then testing on the immediately following out-of-sample window. This reveals whether your strategy adapts to shifting conditions.
- Test on out-of-sample data. Apply your finalized, optimized strategy to the reserved out-of-sample data without modification. This is your most honest performance estimate.
- Document every result. Keep a structured log of parameters tested, metrics recorded, and decisions made. This protects you from confirmation bias and creates a reference for future refinements.
As you refine your approach to autotrading best practices, you will find that documentation is just as important as the testing itself. It forces discipline and gives you a clear audit trail.
Pro Tip: When setting up your walk-forward test, use a minimum of 3 to 5 forward windows. A single walk-forward window is not enough to confirm robustness. The more windows that show consistent performance, the more confidence you can place in the results.
The table below compares typical outcomes you might see between in-sample and walk-forward results:
| Metric | In-sample result | Walk-forward result | What the difference signals |
|---|---|---|---|
| Win rate | 72% | 58% | Moderate overfitting; review entry conditions |
| Max drawdown | 8% | 15% | Risk rules need tightening |
| Sharpe ratio | 2.1 | 1.3 | Acceptable degradation if above 1.0 |
| Profit factor | 3.4 | 1.7 | Investigate whether edge is shrinking |
| Total trades | 340 | 110 | Small sample size warrants caution |
A strategy where out-of-sample metrics hold reasonably close to in-sample metrics is showing genuine robustness. A strategy where performance collapses is telling you clearly to go back and revise before live deployment.
Setting up automated trading on Capital.com after completing this workflow ensures you transition from paper results to live execution with a strategy that has already been stress-tested.
Once your workflow is set, you will need to interpret the results carefully to avoid overconfidence or hidden weaknesses.
Interpreting backtest results: What to look for
Running the backtest is only half the work. Interpreting what the results actually mean is where most traders go wrong. They focus on total return and win rate while ignoring the metrics that reveal whether the strategy is truly investable.
Here are the critical metrics to evaluate:
- Maximum drawdown: The largest peak-to-trough decline in equity. A strategy with a 40% max drawdown is extremely difficult to stick with psychologically, even if the long-term return looks attractive.
- Sharpe ratio: Measures return per unit of risk. A Sharpe ratio above 1.0 is generally acceptable; above 1.5 is strong. Anything below 1.0 suggests the strategy is not adequately compensating for the risk taken.
- Profit factor: The ratio of gross profit to gross loss. A profit factor above 1.5 indicates the strategy generates meaningfully more winning value than losing value.
- Win rate vs. risk-reward ratio: A low win rate is acceptable if the average winner is significantly larger than the average loser. Never evaluate win rate in isolation.
- Consistency across time frames: Test the strategy across multiple time frames, such as the 1-hour, 4-hour, and daily charts. A strategy that only works on one specific setting is almost certainly over-fitted.
- Performance across market regimes: Test during trending markets, ranging markets, and high-volatility periods separately. A strategy that only profits in bull markets offers limited practical value.
One of the most revealing signals of overfitting is an unusually high in-sample win rate paired with poor live or out-of-sample results. If your backtest shows a 90% win rate over 500 trades, that is a red flag, not a green light.
“Treat the backtest as hypothesis testing: aim to falsify and then validate out-of-sample/walk-forward rather than iterating until the in-sample results look good.”
This approach applies equally to automated stock trading and crypto markets. The same validation rigor protects your capital regardless of the asset class. For strategies built around timing entries, reviewing swing trading alerts can help you benchmark whether your signal quality matches what well-structured alert systems actually produce.
Having made sense of your results, it is important to reflect on what actually works and what common misconceptions in backtesting still cost traders real money.
What most traders get wrong about backtesting
Here is the uncomfortable truth: most traders approach backtesting backwards. They start with a result they want to see, then adjust parameters until the historical data confirms it. That process feels productive. It produces impressive-looking charts and encouraging win rates. But it is fundamentally dishonest testing, and it nearly always ends in live trading losses.
The real purpose of backtesting is not to build confidence. It is to find weaknesses before they cost you money. Aggressively curve-fitting historical data does not make you a better strategist. It makes you better at describing the past, which has zero predictive value.
The traders who build genuinely robust strategies do something counterintuitive: they actively try to break their own models. They test in the worst market conditions they can find, including flash crashes, high-spread periods, and low-liquidity sessions. They reduce position sizes and test whether the edge still holds. They change parameters deliberately outside their optimized range to check whether performance falls off a cliff or degrades gradually. A gradual degradation across parameter ranges, what quants call “parameter stability,” is a sign of a real edge. A cliff edge is a sign of an over-optimized model.
Walk-forward analysis is the closest thing to a gold standard in retail backtesting, yet the majority of TradingView users never run it. They test on a single historical window, optimize until the results look good, and then wonder why the strategy fails in live markets two months later.
The framework for long-term strategy optimization consistently reinforces one principle: robustness always beats perfection. A strategy with a Sharpe ratio of 1.3 that holds up across 8 walk-forward windows is far more valuable than a strategy with a Sharpe ratio of 2.8 that only works in a specific 12-month window of the data.
Approach your backtesting like a scientist running an experiment to disprove a hypothesis. If the strategy survives genuine attempts to falsify it, you have found something worth automating.
Automate and optimize your backtested strategies with Tickerly
Once you have a strategy that has been rigorously backtested and validated through walk-forward analysis, the next step is putting it to work without the delays and errors that come from manual execution.

Tickerly connects directly to your TradingView strategies and turns them into fully automated trading bots, executing your signals with precision and speed across supported brokers and exchanges. Whether you are running a trend-following system or a mean-reversion strategy, Tickerly handles the execution layer so your edge is not eroded by latency or missed entries. Explore algotrading on TradingView to see how Tickerly integrates with your setup, and revisit optimizing automated strategies to keep refining your approach after deployment. Your backtest is the foundation. Tickerly is how you build on it.
Frequently asked questions
What is the most common mistake traders make when backtesting?
Curve fitting, or optimizing strategies purely for historical results, is the most frequent and costly error. The correct approach is to treat backtesting as hypothesis testing, aiming to falsify results with out-of-sample data rather than polish in-sample performance.
Can I use TradingView for automated backtesting without coding?
Yes, TradingView provides pre-built strategy libraries and a visual interface that makes backtesting accessible even for traders without deep coding experience. You can load community scripts and run the built-in Strategy Tester without writing a single line of Pine Script.
How do I validate my backtest results?
Use out-of-sample and walk-forward analysis to confirm that results hold up beyond the initial test data. Performance that degrades sharply outside your test window signals overfitting, not a viable strategy.
What performance metrics should I prioritize when backtesting?
Focus on drawdown, Sharpe ratio, and consistency across varying market conditions. A strong walk-forward validated Sharpe ratio above 1.0 combined with controlled drawdown gives you a realistic picture of investable performance.