

TL;DR:
- Trading signal validation proves a signal’s consistent, statistically significant edge before risking capital. It involves backtesting, forward testing, and robustness checks to avoid overfitting and account for real-world market costs. Validated signals help traders manage risk, reduce emotional decisions, and maintain long-term trading success.
Trading signal validation is the process of proving that a signal delivers a consistent, statistically significant edge before you commit real capital to it. Without that proof, you are trading on hope rather than evidence. Most retail traders lose because they cannot distinguish between a real edge and random noise. Validation is the filter that separates profitable signals from expensive mistakes. Tools like backtesting software, paper trading platforms, and robustness tests such as walk-forward analysis and Monte Carlo simulations make this process systematic and repeatable.
Why validate trading signals: the core case
Signal validation is hypothesis testing applied to price behavior. You are not asking whether a signal looks good on a chart. You are asking whether it has produced consistent results across enough trades, market conditions, and cost scenarios to justify live capital.

The difference between a promising signal and a statistically proven edge is significant. A signal that wins 60% of the time over 20 trades could be pure luck. The same win rate over 200 trades, with realistic spreads and commissions included, starts to mean something. Statistical significance requires at least 100 trades, with 200 or more recommended for credible confidence intervals. That threshold exists because small samples produce misleading results.
Validation also forces you to account for real-world friction. Spread, commissions, and slippage all reduce your net return. Adding realistic transaction costs often reveals that a signal with no apparent edge disappears entirely once you model actual execution. That discovery before live trading saves capital.
The benefits of validating signals extend beyond accuracy. Validated signals give you a statistical baseline to compare against live performance. When your live results diverge from that baseline, you have a clear trigger to pause and reassess rather than guessing whether a drawdown is normal or a sign of strategy failure.
-
Filters noise from real edges: Validation removes signals that only appear profitable due to random price patterns.
-
Quantifies expected performance: You get concrete metrics like win rate, average return per trade, and maximum drawdown.
-
Reduces emotional trading: A statistically grounded signal gives you confidence to hold positions without second-guessing.
-
Reveals cost sensitivity: You learn whether your edge survives realistic execution costs before losing money live.
-
Sets performance benchmarks: Validated results create a reference point for monitoring live trading health.
How to validate trading signals: backtesting, forward testing, and robustness checks
Validation is not a single test. It is a layered process where each stage adds a different type of evidence.
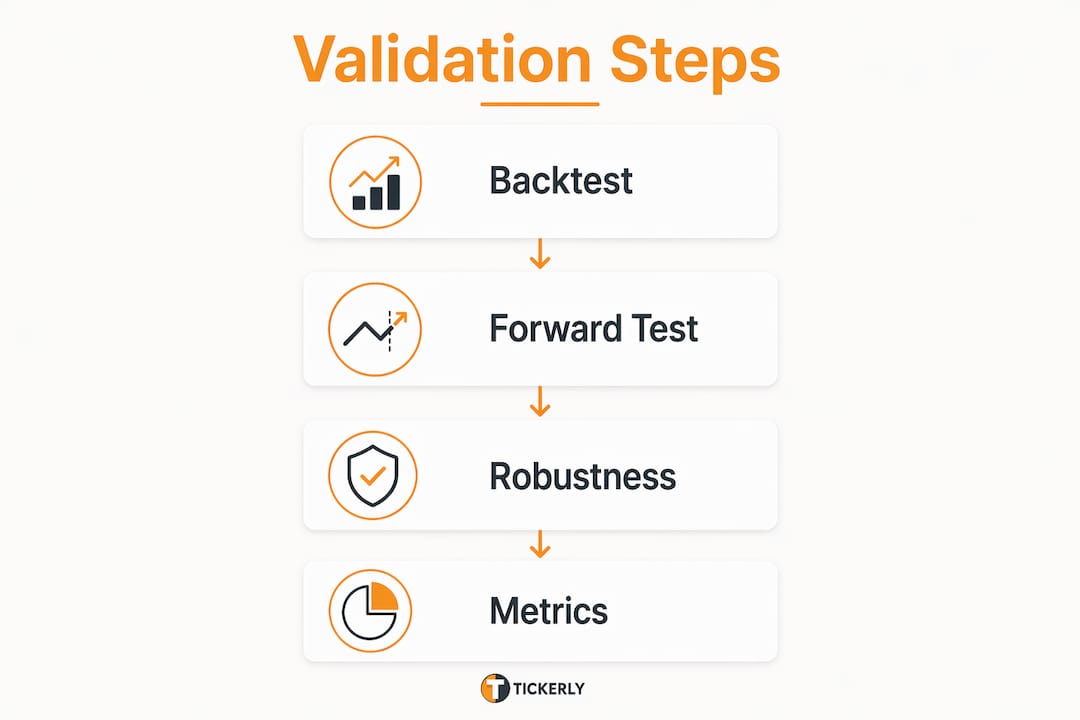
Step 1: Backtest with a large sample
Backtesting runs your signal rules against historical price data. Backtesting reveals structural flaws in a strategy, but it is a discovery tool, not proof of future performance. Use it to identify whether a signal has ever worked, not to confirm that it always will. Aim for 100–200 trades minimum in your backtest window to reach statistical significance.
Step 2: Forward test with paper trading
Forward testing runs your signal in real-time market conditions without real money. Experts recommend 30–50 paper trades before deploying live capital. Compare your forward test results to your backtest results. If the two diverge by more than 20%, stop and investigate the cause before going live.
Step 3: Apply robustness checks
Walk-forward analysis and Monte Carlo simulations test whether your signal holds up across different data windows and randomized trade sequences. These checks catch signals that only work on the specific historical period you tested. A signal that survives both is far more likely to perform in live markets.
Step 4: Evaluate key metrics
Use this reference table to assess whether your signal meets professional standards:
| Metric | Acceptable range | Red flag |
|---|---|---|
| Sharpe ratio | 1.0–2.0 | Above 3.0 may indicate overfitting |
| Out-of-sample return vs. in-sample | At least 40% of in-sample return | Below 40% suggests curve-fitting |
| Forward test divergence | Under 20% vs. backtest | Above 20% requires investigation |
| Drawdown in live trading | Within 1.5x backtest max | Exceeding 1.5x is a stop signal |
A Sharpe ratio above 3.0 is a warning, not a celebration. Ratios that high almost always indicate a strategy tuned too tightly to historical data.
Pro Tip: Run your backtest on an out-of-sample data set you have never touched during development. If performance collapses on that unseen data, the signal is not valid regardless of how well it performed in-sample.
Common pitfalls in trading signal validation
Most validation failures share a common root: traders treat the process as parameter hunting rather than evidence gathering.
The optimization trap
The optimization trap occurs when you tune a strategy’s parameters until it fits historical data perfectly. Overly tuned strategies are fragile. They perform well on the data they were built on and fail immediately in live markets. The fix is to identify stable parameter zones that perform consistently across a range of values, not a single peak.
Many traders treat backtesting as a search for the best historical parameters rather than a search for stable, regime-independent behavior. That distinction is what separates a durable signal from a curve-fitted illusion. Tickerly’s guide on avoiding backtesting errors covers this in practical detail.
Ignoring execution costs
A signal that looks profitable on paper often disappears when you add spread, commissions, and slippage. Profitability disappears when realistic transaction costs are applied, confirming there was never a true tradable edge. Always model worst-case execution, not best-case.
Misreading short winning streaks
Confidence built on short streaks without statistical proof leads to premature over-sizing and devastating drawdowns. Five or ten consecutive wins prove nothing about signal reliability. True proof requires stable execution across a statistically meaningful sample.
-
Avoid single-period backtests: Test across multiple market regimes including trending, ranging, and volatile conditions.
-
Model slippage conservatively: Use wider slippage estimates than you expect to stress-test the signal’s edge.
-
Use orthogonal filtering: Orthogonal filtering applies independent statistical tests to disqualify signals that expose different failure modes, reducing overfitting risk.
-
Do not optimize after forward testing: Changing parameters based on forward test results defeats the purpose of out-of-sample validation.
Pro Tip: If your signal only works with one specific parameter combination, it is not a real edge. Real edges work across a range of reasonable settings.
How validated signals improve strategy and risk management
Validation does not end when you go live. It becomes the foundation of your ongoing trading discipline.
A validated signal gives you a statistical baseline for position sizing. If your backtest shows a maximum drawdown of 8%, you can size positions so that a full drawdown sequence does not exceed your risk tolerance. Without that baseline, position sizing is guesswork. With it, you can apply fixed fractional or Kelly-based sizing with confidence grounded in real data.
Monitoring live performance against your backtest forecast is equally important. Stop trading and reassess if your live drawdown exceeds 1.5 times the backtest maximum, or if your live Sharpe ratio drops below half the backtest value. These thresholds are not arbitrary. They mark the point where normal variance becomes evidence of strategy failure.
Building a repeatable trading signals workflow around validated signals also removes emotion from execution. When you know a signal has a proven edge, you execute it consistently instead of second-guessing entries during drawdowns. That discipline is what separates traders who survive long-term from those who abandon working strategies too early.
-
Set drawdown limits before going live: Define the exact drawdown level that triggers a strategy pause.
-
Track live metrics weekly: Compare win rate, average return, and Sharpe ratio against your backtest benchmarks.
-
Revise, do not abandon: If performance degrades, investigate the cause before scrapping the signal entirely.
-
Diversify across validated signals: Running multiple validated signals simultaneously reduces single-strategy risk.
Pro Tip: Keep a validation log for every signal you trade. Record backtest metrics, forward test results, and live performance side by side. Patterns in that log will teach you more about your trading than any single trade ever will.
Key takeaways
Signal validation is the single most reliable method for separating real trading edges from noise, overfitting, and false confidence before capital is at risk.
| Point | Details |
|---|---|
| Sample size matters | Use at least 100–200 trades in backtesting to reach statistical significance. |
| Layer your validation | Combine backtesting, forward testing, and robustness checks for credible proof. |
| Include execution costs | Always model spread, commissions, and slippage before declaring a signal valid. |
| Watch live divergence | Halt trading if live drawdown exceeds 1.5x the backtest maximum. |
| Avoid the optimization trap | Stable parameter zones across regimes beat single-peak historical fits every time. |
Signal validation is the edge most traders skip
I have watched traders blow up accounts not because their signal was wrong, but because they never proved it was right. They saw a few winning trades, felt confident, sized up, and then hit a drawdown they had no framework to evaluate. Was it normal variance? Was the signal broken? They had no baseline to answer that question.
The uncomfortable truth about signal validation is that it is slow and unglamorous. Running 200 backtested trades, then 50 paper trades, then comparing metrics against benchmarks takes weeks. Most traders skip it because they want to trade now. That impatience is exactly what trading strategies fail to survive.
What I have found actually works is treating validation as a non-negotiable gate. No signal enters live trading without passing all three layers: backtest with realistic costs, forward test with sufficient sample size, and robustness check across multiple market conditions. That process has saved me from more bad trades than any indicator or pattern ever could.
Signal validation is a competitive advantage that separates traders who preserve capital from those who lose it to noise and false positives. The traders who validate rigorously are the ones still trading five years later.
— Jay
Putting validated signals to work with automation
Validating a signal is only half the equation. Executing it consistently, without hesitation or emotional interference, is the other half.

Tickerly connects your validated TradingView strategies directly to live exchange accounts, executing trades the moment your signal fires. There is no manual delay, no second-guessing, and no missed entries because you were away from the screen. For traders who have done the work of validation, Tickerly makes sure that work pays off at execution speed. Explore how automated trading bots can turn your validated signals into consistent, emotion-free performance across crypto, forex, and stock markets.
FAQ
What does it mean to validate a trading signal?
Validating a trading signal means proving it produces a consistent, statistically significant edge across enough trades and market conditions to justify real capital. The process includes backtesting, forward testing, and robustness checks.
How many trades are needed to validate a signal?
At least 100 trades are required for statistical significance, with 200 or more recommended for credible confidence intervals. Fewer trades produce results that could reflect luck rather than a real edge.
What is the optimization trap in signal validation?
The optimization trap occurs when traders tune strategy parameters too tightly to historical data, creating a system that fits the past but fails in live markets. Stable parameter zones that work across a range of values are more reliable than single-peak fits.
When should you stop trading a validated signal?
Stop trading and reassess if your live drawdown exceeds 1.5 times the backtest maximum, or if your live Sharpe ratio drops below half the backtest value. These thresholds indicate the signal may no longer be functioning as validated.
Does backtesting alone prove a signal is valid?
Backtesting alone is not proof. It is a discovery tool that reveals structural flaws. Forward testing and robustness checks like walk-forward analysis and Monte Carlo simulations are required to confirm that a signal is genuinely tradable.