

Most traders who experience repeated strategy failures assume the strategy itself is broken. That assumption is almost always wrong. Understanding why trading strategies fail requires looking past the surface losses and into the mechanics of execution, testing methodology, and market behavior. Only 1.3% of retail strategies survive six months of live trading with positive risk-adjusted returns. That number alone tells you the problem runs deeper than strategy selection. This guide breaks down the specific, quantifiable failure modes behind that statistic and shows you exactly what to do about each one.
Table of Contents
Key Takeaways
| Point | Details |
|---|---|
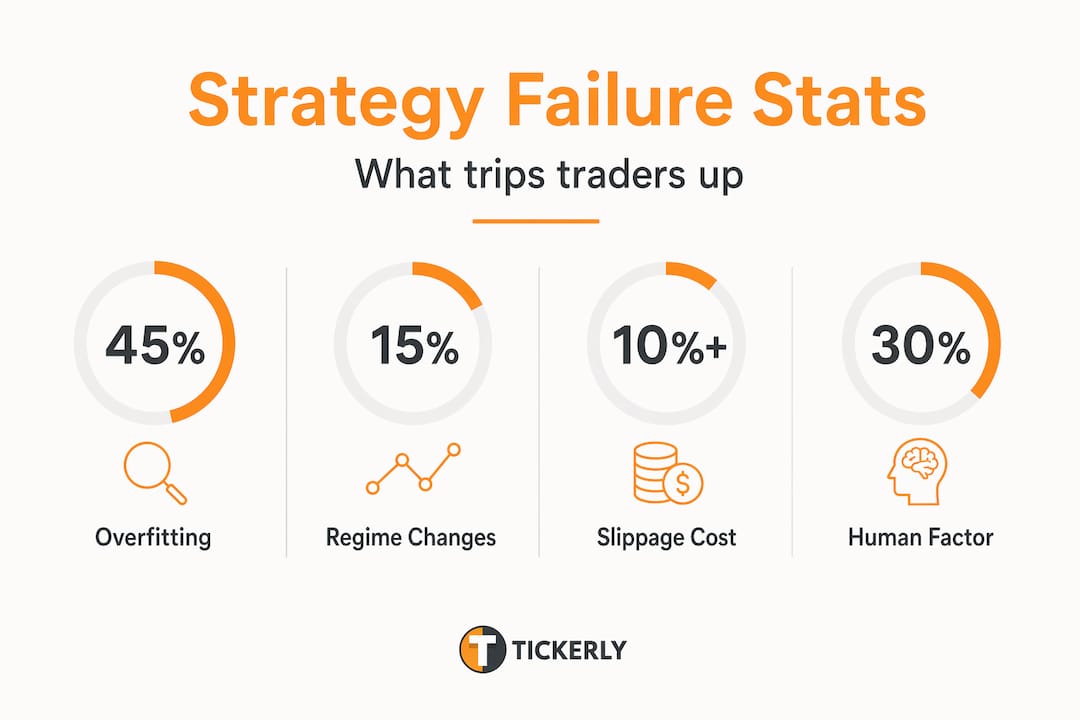
| Overfitting is the top killer | Nearly 45% of strategy failures trace back to over-optimization on historical data that breaks down in live conditions. |
| Transaction costs destroy margins | A small per-trade slippage of 0.027% can create over 10% annual drag, wiping out a large portion of expected returns. |
| Regime changes cause real damage | About 15% of failures come from strategies encountering market conditions they were never designed for. |
| Most losses are normal variance | Roughly 60-70% of losses in a positive-expectancy strategy are statistical noise, not proof that the strategy is broken. |
| Execution discipline is the final edge | The gap between a strategy’s plan and its actual execution is where most recoverable profits disappear. |
Why trading strategies fail: the science of overfitting
Overfitting is when you tune a strategy so precisely to historical price data that it stops modeling real market behavior and starts modeling random noise. The result looks brilliant in backtesting and collapses within weeks of going live.
Overfitting accounts for roughly 45% of all trading strategy failures, with most of those failures surfacing within two to eight weeks of deployment. A strategy with 15 or more tunable parameters has enough degrees of freedom to fit nearly any historical dataset — including meaningless fluctuations that will never repeat.
Here is what makes overfitting especially dangerous: it is invisible during the research phase. Your backtest equity curve looks smooth, your Sharpe ratio looks strong, and your drawdowns appear controlled. None of that is real. It is a reflection of the past, not a prediction of the future.
Pro Tip: Run parameter sensitivity testing by shifting each input value 10-20% up and down. If your strategy’s performance collapses with minor parameter changes, you are likely curve-fitting. Robust strategies show gradual, not cliff-edge, degradation.
To detect and prevent overfitting, you need to build a proper validation pipeline. Start with validating your trading strategies using out-of-sample data that was never touched during development. Then consider:
-
Walk-forward testing: Optimize on a rolling window and test on the next period, repeating across the full dataset
-
Cross-instrument testing: A momentum strategy tuned on S&P 500 futures should also work on DAX or crude oil with similar logic
-
Crisis period inclusion: Backtest success on narrow, crisis-free data is suspect. Include 2008, 2020, and 2022 in your test period
-
Monte Carlo simulation: Shuffle trade sequences to stress-test performance across thousands of hypothetical outcome paths
The goal is not a perfect backtest. The goal is a robust strategy that performs acceptably across conditions it has never seen before.
Execution gaps, slippage, and transaction costs
Here is an uncomfortable truth: your backtest assumes you buy and sell at the exact price shown on the chart. In live markets, you almost never do. That gap between theoretical and actual fills is where a surprising amount of profit evaporates.

Transaction costs come in three forms. Commissions are the most visible and the easiest to model. Spread, the difference between bid and ask prices, is less obvious but always present. Slippage, the difference between the price you expected and the price you received, is the most unpredictable and the most destructive over time.
Small per-trade slippage of 0.027% compounds to approximately 10.8% annual drag. For a strategy targeting 25% annual returns, that translates to consuming 43% of your expected profit before you count commissions or spread.
| Execution Cost Type | Source | Annual Impact (Example) |
|---|---|---|
| Commission | Broker fees per trade | 0.5% to 2% depending on trade frequency |
| Bid-ask spread | Market microstructure | 1% to 5% for illiquid instruments |
| Slippage | Latency, liquidity, volatility | Up to 10.8% for active strategies |
| Total drag | Combined effect | Can exceed 15% for high-frequency approaches |
Three factors drive slippage: latency (the time delay between signal and order submission), liquidity (thin order books move against large orders), and volatility (fast-moving markets execute far from the signal price). Higher-frequency strategies suffer the most. For active strategies, turnover and execution complexity dominate total costs, making thorough modeling non-negotiable.
Pro Tip: Rerun every backtest at 2x and 3x your assumed slippage. If the strategy becomes unprofitable at 3x slippage, it has almost no real-world edge. Cost sensitivity testing is the single fastest way to separate viable strategies from ones that only work on paper.
The fix is straightforward in principle: model execution realistically from day one. Use bid-ask data where available, apply conservative slippage assumptions based on your trade size and the instrument’s average daily volume, and revisit your cost model every time market conditions shift.
Market regimes and survivorship bias
Markets are not stable environments. They cycle between trending and mean-reverting behavior, between high and low volatility, between risk-on and risk-off sentiment. A strategy that thrives in one regime frequently breaks down in another.
Regime changes cause approximately 15% of strategy failures, with associated drawdowns ranging from 10 to 30%. A momentum strategy that performed beautifully during the 2020 to 2021 bull run often struggled severely during the mean-reverting, high-volatility conditions of 2022. This is not a strategy flaw. It is a regime mismatch, and there is a meaningful difference between the two.
Alongside regime risk, survivorship bias quietly inflates backtest expectations. When you test a strategy on “the market,” you are usually testing it on assets that still exist. In crypto specifically, survivorship bias inflates backtest returns by 10 to 20% annually because roughly 12,000 cryptocurrencies have gone to zero since 2013. If your test universe only includes coins that survived, you are measuring performance in a world that no longer exists.
Here is how to build for regime resilience:
-
Regime detection: Use volatility filters (ATR-based) or trend strength indicators (ADX) to classify the current market environment before entering a trade
-
Multi-regime backtesting: Deliberately test your strategy across trending, ranging, and crisis periods in the historical dataset
-
Portfolio balancing: Combine strategies with different regime profiles, pairing a momentum system with a mean-reversion system to reduce correlated drawdowns
-
Dead-coin correction: When testing crypto strategies, manually include delisted assets in your test universe or use survivorship-bias-free data providers
The goal is not to predict regime changes. The goal is to build strategies that can tolerate them, or to know clearly when to step aside.
The human factor in strategy failure
You can design a statistically sound strategy and still lose money with it. That happens when the person executing the strategy introduces errors the backtest never accounted for. This is what experienced traders call the strategy trap: executing a losing version of a winning strategy.
Emotional interference shows up in predictable patterns. Fear causes you to move stop-losses wider after a few losses, increasing your risk per trade beyond the tested parameters. Greed pushes you to hold winners past your exit signals, then watch them reverse. Impatience causes you to enter trades that meet only some criteria, not all of them. Each deviation seems minor in isolation. Compounded over hundreds of trades, they destroy your statistical edge.
Fear, greed, and impatience convert sound strategy rules into improvised decisions in the heat of a trade. The result is a live track record that looks nothing like the backtest, not because the strategy failed, but because you did not execute it.
To build execution discipline, follow this practical sequence:
-
Log every trade deviation. Write down each time you entered outside your criteria, moved a stop, or exited early. You cannot fix what you do not measure.
-
Identify your emotional triggers. Note whether deviations cluster around losing streaks, specific session times, or particular instruments. Patterns emerge quickly.
-
Implement a pre-trade checklist. Before every entry, verify each rule is met. No criteria checked, no trade taken. Full stop.
-
Review your execution weekly, not your P&L. Shift your focus from outcome to process. Good process produces good results over time, even when individual trades lose.
Pro Tip: Explore algo trading pitfalls and consider automating rule-based entries and exits. Automation removes the emotional layer entirely and executes your strategy exactly as designed, every time.
Diagnosing failure modes correctly
When your strategy starts losing, the worst thing you can do is immediately change it. Most of the time, nothing is broken. About 60 to 70% of losses in positive-expectancy strategies are the result of normal statistical variance, the natural distribution of outcomes that any probabilistic system will produce.
Misdiagnosing variance as a strategy flaw triggers a destructive response: you add rules, shift parameters, and complicate the system based on hindsight. Most retail traders accumulate 8 to 12 extra rules over time through this process, each one designed to eliminate a past loss that was never likely to repeat. The result is a strategy so over-fitted to recent history that it loses its original edge entirely.
Here is how to categorize losses accurately before responding:
-
Variance (60-70% of losses): The strategy is performing within its expected statistical range. The correct response is patience. Do not adjust anything.
-
Execution timing misses (10-15%): You entered too early, too late, or missed exits. The strategy is fine. Your execution process needs tightening.
-
Criteria drift (10-15%): You bent your entry rules over time. Audit your recent trades against the original criteria and restore discipline.
-
Regime mismatch (5-10%): The market environment has shifted materially. Consider pausing the strategy or reducing position size until the regime normalizes.
The correct response to each failure mode is categorically different. Treating variance as a regime problem or treating regime mismatch as variance leads to decisions that make things worse. Take the time to diagnose accurately first.
My perspective on why traders keep getting this wrong
I’ve spent years watching traders cycle through strategies the way some people cycle through diets. A system stops working for two weeks, and they abandon it. The next one gets two weeks, then another abandonment. None of them ever get a fair sample size.
What I’ve learned is that the failure is almost never the strategy. It’s the relationship between the trader and the strategy. I’ve seen people take genuinely profitable systems and turn them into losers through inconsistent execution, panic-driven parameter tweaks, and emotional position sizing. The system was fine. The human was not.
The thing that transformed my results was not finding a better strategy. It was building a process for auditing my own execution. I started keeping a detailed log of every rule I broke and why. Within a month, I had a clear picture of my emotional triggers and exactly when I was most likely to deviate. That data was worth more than any indicator combination I had ever tested.
My honest advice: stop optimizing your strategy when you’re losing. Start auditing your execution. Most of the time, the gap between plan and execution is where your profits are hiding. Fix the human first, then revisit the strategy with clean data.
— Jay
Take the human error out of your trading
Understanding why trading strategies fail is only half the work. The other half is building a system that removes the most preventable failure mode: inconsistent human execution.
Tickerly turns your TradingView strategies into fully automated trading bots that execute every entry, exit, and stop exactly as designed. No emotion. No deviation. No missed signals at 3 a.m. When you pair a properly validated strategy with automated execution that accounts for realistic slippage and cost modeling, you close the gap between backtest performance and live results. Explore how automated bots improve execution and reduce the human errors that silently kill strategy profits. If you’re ready to deploy your TradingView strategy, Tickerly’s algotrading on TradingView guide walks you through the full setup from strategy to live bot.
FAQ
What is the main reason trading strategies fail?
Overfitting is the leading cause, accounting for roughly 45% of failures. Strategies tuned too closely to historical data break down quickly in live market conditions.
How much does slippage actually cost a trader?
A per-trade slippage of just 0.027% compounds to over 10% annual drag, which can consume nearly half of expected profits for strategies targeting 25% annual returns.
Should I change my strategy when it starts losing?
Not immediately. 60 to 70% of losses in statistically sound strategies are normal variance. Diagnose the failure mode first before making any changes.
How do market regime changes affect trading strategies?
Strategies optimized for trending markets often fail in mean-reverting conditions. Regime changes account for about 15% of strategy failures, with drawdowns reaching 10 to 30%.
Can automation fix execution-related strategy failures?
Yes. Automated trading removes emotional interference and rule deviation, which are the core causes of execution-related failures. A bot executes your strategy exactly as designed on every trade, every time.