

Yes, you can run a grid bot through TradingView. TradingView hosts public grid scripts and simulators that generate webhook-ready alerts, so the platform itself isn’t the barrier. To go live, you validate a script in a simulator, build alert messages with a full JSON payload, and route those alerts through a reliable execution bridge to your exchange or broker. Start by loading a grid script on a chart and running it through a simulator before writing a single alert.
TL;DR:
Static grid bounds should be wide enough to contain a typical market range, especially if the asset exhibits frequent breakouts or trending behavior.
Using ATR-based spacing and auto-recenter features helps adapt the grid to market volatility, reducing exposure to trend runs.
Setting a kill switch to stop trading if price exceeds outer bounds or if exposure on one side becomes excessive prevents catastrophic losses during strong trends.
Send one alert per grid strategy in your execution platform’s format, and test it on a demo account to catch duplicated or missed orders before live trading.
Backtest with a dedicated simulator, analyze maximum drawdown and exposure, and run a demo before deploying a grid strategy with real capital.
Table of Contents
-
What Settings Should You Expect in a TradingView Grid Script?
-
What Risk Controls Keep a Grid Bot From Wiping Your Account?
-
DIY Automation vs. a Managed Execution Bridge: Which Fits You?
How Do Grid Trading Bots Actually Work?
A grid bot works by placing a ladder of buy and sell orders across a price range, collecting small profits every time price bounces between levels. The mechanics are simple on the surface. What separates a script that prints steady gains from one that blows through an account is how the grid is bounded, spaced, and sized.
Every grid script defines a few core elements. The upper bound and lower bound set the price range the grid operates in. Levels per side determine how many buy and sell orders sit above and below the current price. Spacing controls the distance between levels, expressed as a fixed dollar amount, a percentage, or a volatility multiple. Some scripts add a neutral zone near the current price where no orders sit, reducing noise trades during choppy consolidation.

Range-based grids are built for markets that oscillate without a clear direction. You set a wide enough range to capture the asset’s typical swing, space the levels tightly enough to catch frequent bounces, and let the bot buy dips and sell rallies inside that channel. This is where grid trading earns its reputation: a coin or currency pair chopping sideways for weeks can generate dozens of small, compounding wins without you touching a chart.
Trend-following, or dynamic, grids take a different approach. Instead of a fixed range, they shift with the market using ATR-based spacing and auto-recenter logic. The Dynamic Grid BOT Engine script, for example, calculates grid step size from the Average True Range and repositions the entire grid as price trends, using tilt and anchor settings to bias order placement in the direction of the move. This matters because a static grid built for a sideways market will get run over the moment that market starts trending.
Price drifts down through three levels, filling three buy orders. It then reverses and climbs back up, filling the corresponding sell orders one level above each buy. Each round trip locks in a small, repeatable profit. That’s the entire engine of grid trading, working correctly.
The failure mode shows up when price breaks decisively past the grid’s outer bound. At that point, you’re either sitting on unfilled orders far from the market or holding a stack of one-sided positions that keep losing as price runs away. This single risk drives most of the tuning decisions covered later in this piece.
-
Upper and lower bounds define the price range the grid will trade inside.
-
Levels per side and spacing determine trade frequency and profit per fill.
-
Range grids suit sideways markets; dynamic grids adapt spacing and position to trends.
-
A neutral zone reduces unnecessary trades near the current price.
-
Breakouts beyond the grid’s bounds are the primary way grids lose money.
Pro Tip: Before trusting any grid script’s default settings, plot the asset’s historical range on the timeframe you plan to trade. If price has broken its recent range more than once or twice a year, a static grid needs wider bounds or a kill switch, not just tighter spacing.
What Settings Should You Expect in a TradingView Grid Script?
Open any well-built grid script and you’ll find a settings panel that reads almost like a checklist. Knowing what each input controls lets you evaluate a script in minutes instead of guessing your way through a chart full of lines.
Core grid inputs to expect:
-
Upper and lower limits. Either entered manually or calculated automatically from a lookback period.
-
Number of grids. More levels mean more frequent, smaller trades; fewer levels mean larger, less frequent ones.
-
Spacing mode. Fixed dollar amount, fixed percentage, or ATR-based (volatility-adjusted).
-
Signal trigger. Wick-touch (price simply touching a level) versus bar-close confirmation.
-
Cooldown settings. A minimum time or bar count between signals on the same level to prevent alert spam.
The Grid Bot Simulator script is a good reference point here. It exposes upper and lower limit fields, a grid-count slider, and a toggle between wick-touch and bar-close triggers, then visualizes how those settings behave differently in a ranging market versus a trending one. Running the same asset through both trigger modes on that simulator is often the fastest way to see why trigger choice matters more than most traders assume.
Beyond the basics, the stronger scripts on TradingView add features that reduce manual math and guesswork:
-
Profit-per-level calculator. Shows expected profit for each grid line based on spacing and position size, so you’re not calculating it by hand.
-
Auto-recenter. Automatically shifts the grid when price drifts too far from center, keeping levels relevant instead of stale.
-
Neutral zone. A buffer band around current price where no new orders trigger, cutting down on whipsaw trades.
-
Tilt and anchor for trending markets. Biases grid density toward the direction of a detected trend rather than treating up and down moves symmetrically.
-
Dashboard readouts. An on-chart table showing active levels, unrealized exposure, and recent fills.
Public, open-source Pine Script grid tools like Gridbot let you read the underlying code line by line. That transparency matters more than it might seem. You can confirm exactly how a signal fires, whether the script recalculates on every tick or only at bar close, and whether the “auto-recenter” logic actually triggers under the conditions the description claims. Closed scripts ask you to trust a black box; open ones let you verify.
Alert exposure varies by script, but most well-documented grid tools let you choose between alerting on every level touch, only on confirmed fills, or only on grid boundary events (recenter, breakout warning). For anything you intend to automate, favor a script that lets you set alerts on bar close rather than every intrabar tick. Wick-touch triggers fire faster, but they also increase false signals from brief price spikes that reverse before the bar closes, which is a costly problem once real orders are attached to every alert.
If you’re new to reading or modifying these scripts, a primer on Pine Script fundamentals will save you time before you start tweaking someone else’s grid logic.
How Do You Turn TradingView Alerts Into a Live Grid Bot?
Getting a grid script to plot correctly on a chart is the easy part. Turning its signals into real orders on an exchange is where most DIY automation projects either succeed cleanly or quietly fail. Here’s the sequence that actually works.
Step 1: Validate the script before you touch a live alert.
Run the grid script through TradingView’s strategy tester first, then cross-check the results against a dedicated simulator like the Grid Bot Simulator mentioned earlier. Pay close attention to whether the script evaluates on every tick (intrabar) or only when a bar closes. Intrabar signals feel more responsive but can repaint or fire on price wicks that never actually confirm, which means your simulated results might look better than what a live bot would experience.
Step 2: Configure your alerts with a complete JSON payload.
TradingView’s alert system lets you attach a custom message to any alert condition, and for automation that message needs to be structured, not a plain-English note. A workable payload typically includes:
-
ticker — the specific ticker or trading pair associated with the alert.
-
action — indicates whether to buy or sell.
-
prev_position — the previous market position.
-
quantity — the order size in the instrument’s units, normally
{{strategy.order.contracts}}so the size your strategy calculates is the size that trades. -
pointer — the unique identifier for the exchange account to be used
On Tickerly you don’t assemble this by hand: copy the ready-made alert message for your connection from My exchanges and paste it into the strategy alert, with the webhook URL http://alerts.tickerly.net. The strategy placeholders only work on strategies, so if your grid script is an indicator, use Tickerly’s directional alerts with fixed values instead. The alert carries no limit price, so the grid’s ladder lives in the script and each level is sent as an order when it triggers.
Step 3: Set up a webhook receiver that can actually handle production traffic.
Your execution bridge, whatever form it takes, needs to do more than just catch the JSON and forward it. It has to tie each alert to the right account without putting credentials in the message, respect the rate limits of whichever exchange API you’re trading on, and report what happened to every order. On Tickerly, your private pointer identifies the connection (keep it private, since the alert carries no API keys), each alert and the exchange’s response land in the alert log, and rejections trigger a notification. A grid bot generating a dozen alerts an hour also needs a plan that covers its daily alert volume: 100 alerts a day on Level 2, 1,000 on Levels 3 and 4, and 2,500 on Level 4 Ultra.
Step 4: Add execution-level safety checks before orders hit the exchange.
Size every level in the strategy so the full ladder fits your available balance. An order the exchange rejects for insufficient balance or margin shows up in Tickerly’s alert log and notifications rather than failing silently. Send exits with prev_position, so Tickerly marks closing orders reduce-only and a repeated sell can only flatten a long, never open a short. Watch for partial fills too. A grid level that fills only halfway leaves your position sizing off for every subsequent level, compounding small errors into a meaningfully skewed exposure over a few dozen fills. Tickerly doesn’t compare the strategy’s position with the exchange’s, so check the exchange position against the strategy regularly.
Pro Tip: Test your webhook payload with a dummy alert before connecting it to a live grid. Send a handful of test JSONs with different symbols and sizes, and confirm your bridge logs each one distinctly. If duplicates or dropped fields show up in testing, you just found the bug before it cost you money.
For a full walkthrough of building this pipeline end to end, Tickerly’s guide to building a step-by-step trading bot covers the alert-to-execution handoff in more technical detail than fits here.
How Should You Backtest a Grid Bot Before Going Live?
Backtesting a grid strategy is different from backtesting a directional strategy, and treating it the same way is where a lot of promising grid setups fall apart in live trading.
TradingView’s built-in strategy tester has real limitations for grid systems specifically. It models fills at a bar-by-bar granularity, which means intrabar price action, the kind that determines whether a grid level actually gets touched and filled, is often approximated rather than precisely simulated. Slippage assumptions baked into the tester also rarely match what you’ll experience on a live exchange during a volatile session, especially with lower-liquidity pairs.
This is why a dedicated grid simulator earns its place in your workflow alongside the standard tester. Visual simulators let you watch how a specific configuration behaves across both ranging and trending historical periods, which is exactly the scenario that matters most: how the grid holds up when price stops ranging and starts trending. Running a Monte Carlo style stress test, shuffling the order and timing of historical price moves, adds another layer by revealing how badly a worst-case, one-sided fill sequence would hurt the account.
Four metrics matter more than total return when you’re evaluating a grid configuration:
-
Maximum drawdown. The worst peak-to-trough loss the strategy would have experienced.
-
Largest one-sided exposure. How much capital would be tied up if price ran in one direction and filled every level on that side.
-
Recovery time. How long the strategy took to climb back from its worst drawdown.
-
Profit factor and trade frequency. Gross profit divided by gross loss, alongside how often the grid actually trades, since a grid with great profit factor but almost no fills isn’t doing much for you.
The testing sequence that catches problems early looks like this: backtest across a long historical window first, then run the same settings on an out-of-sample period the strategy hasn’t seen. If performance holds up, move to a demo forward test on live market data with no real money at risk. Only after that demo period shows consistent, expected behavior should you move to a small-live pilot with minimal capital. Skipping straight from backtest to full live deployment is the single most common mistake grid traders make, and it’s the one that turns a promising script into an expensive lesson.
What Risk Controls Keep a Grid Bot From Wiping Your Account?
Every grid bot eventually faces a market that stops ranging and starts trending hard in one direction. Whether that event is a minor inconvenience or an account-ending event comes down to decisions you make before the bot goes live, not decisions you make while watching it happen.
Sizing per level is the first line of defense. Before setting your number of levels, calculate what happens if every buy order on one side fills, an all-in, one-sided scenario. If your total capital allocated to the grid can’t absorb that full one-sided fill and still leave margin for the position to eventually reverse, your level count or per-level size is too aggressive for your account. This survival-sizing check should happen before you go live, not after a drawdown forces the question.
Spacing is a tradeoff between frequency and resilience. Tight spacing generates more trades and more small profits during genuine ranging conditions, but it also means the grid fills through its full range faster during a directional move, exposing you to that one-sided risk sooner. Wider spacing, especially spacing tied to a volatility measure like ATR, adapts to how much the asset is actually moving instead of using an arbitrary fixed distance. For crypto on 4-hour timeframes, ATR multipliers between 0.3 and 0.7 are common starting points; for forex pairs, ATR multipliers usually suit typical volatility, though every pair and timeframe needs its own calibration.
Kill switches turn a risk plan into an actual safeguard. Three patterns come up repeatedly in well-built grid setups:
-
A hard stop that closes the entire grid if price closes beyond the outer bound, rather than waiting for a wick to touch it.
-
A maximum one-sided exposure limit that halts new orders once a set percentage of capital sits on one side of the grid.
-
A time-based pause that suspends the grid after a defined number of consecutive same-direction fills, giving you a chance to reassess before the trend runs further.
Tight grid spacing without any of these controls is a common and avoidable mistake. It looks great in a backtest covering a calm, range-bound period and then fails badly the first time that same asset trends for a week straight.
As a purely illustrative example, not financial advice, a trader running a $2,000 grid on a mid-volatility crypto pair might use eight levels per side, ATR-based spacing at a 0.5 multiplier, and a kill switch set to pause the grid if three consecutive levels fill in the same direction. The exact numbers should shift based on your own capital, risk tolerance, and the asset’s actual behavior, but the structure, sized levels plus a spacing rule plus a hard stop, is what separates a durable grid from a fragile one.
Pro Tip: Set your kill switch threshold based on your worst-case backtest drawdown, not your average one. Grids that look stable for months can still have a single bad month buried in the historical data that tells you exactly where your real risk ceiling sits.
DIY Automation vs. a Managed Execution Bridge: Which Fits You?
Building your own webhook receiver and execution bridge is a legitimate path, and for traders who enjoy the technical side of Pine Script and don’t mind monitoring uptime, it can work well. You control every line of logic, you can tweak payload structure on a whim, and you learn the mechanics of order execution in a way that pays off across every future strategy you build.
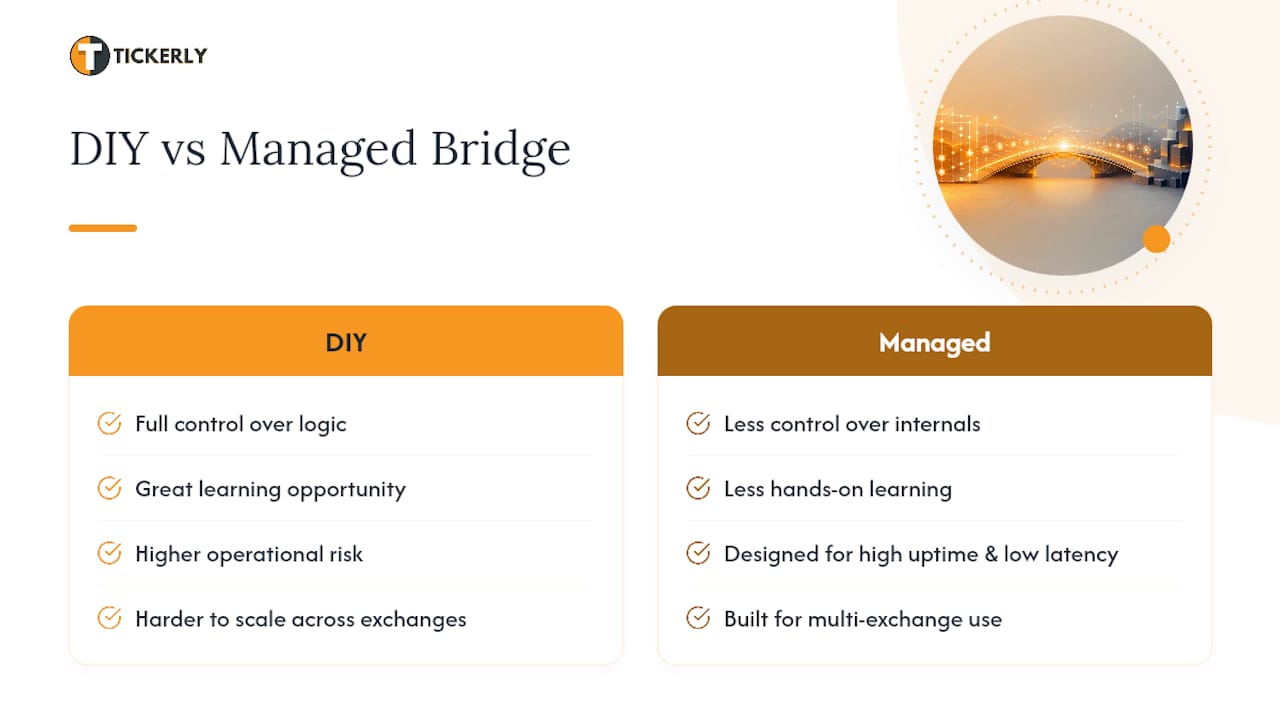
That said, the honest tradeoff is operational risk. A DIY bridge that goes down during a fast market move, or drops an alert because of a rate limit you didn’t account for, doesn’t fail quietly. It fails at the exact moment your grid needed it most. Uptime, low latency between signal and order, reliable parsing of alert payloads, and support for multiple exchanges simultaneously are the priorities that matter once you’re running real capital, and they’re also the priorities that take the most ongoing engineering effort to maintain solo.
My honest read: if you’re a developer who wants to learn the plumbing and you’re comfortable debugging your own code at 2 a.m. when something breaks, build it yourself, and budget for the hosting, security and maintenance that come with it. It’s a genuinely good way to learn. But the moment you want to run multiple strategies across multiple exchanges, or you simply can’t be the person on call when a webhook silently fails, a managed execution bridge removes a category of risk that has nothing to do with your trading strategy and everything to do with infrastructure. Demo both routes before committing capital to either one. If reliable, low-latency execution across exchanges is the goal, a managed bridge is worth the evaluation.
— Jay
Get Your Grid Script Running Live With Tickerly
Once your grid script is validated and your alert payloads are structured, Tickerly is the execution bridge that closes the gap between a TradingView signal and a filled order, without you building and maintaining that infrastructure yourself. Tickerly ingests your TradingView alerts, parses the webhook payload, and routes orders to your connected exchange with the kind of execution speed that matters when a grid needs to fire multiple fills in quick succession during a volatile session.
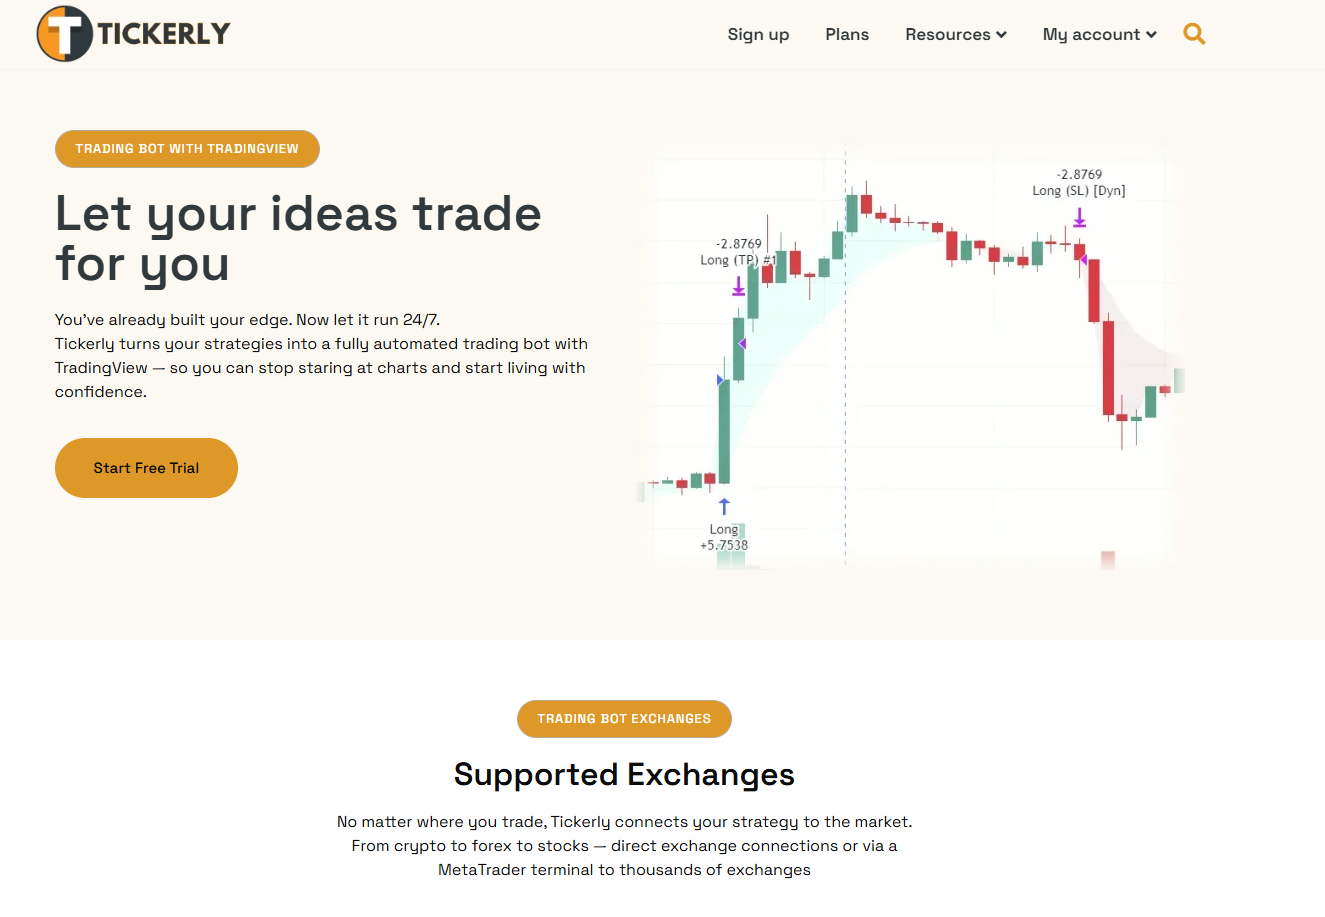
This setup supports grid automation with low latency, allows running multiple grid strategies across different assets, and facilitates a transition from demo testing to live trading without rebuilding your automation stack at each stage. If you want to see exactly how a TradingView alert becomes a live order, walk through TradingView Strategy Automation: How to Go From Alert to Live Order and start your free trial to connect your first grid script today.
Resources for Testing and Building TradingView Grid Bots
Start with the scripts themselves. Gridbot is a solid open-source entry point for reading actual grid logic, while the Grid Bot Simulator is the fastest way to visualize how a given configuration handles ranging versus trending price action before you write a single alert.
For the automation side, Tickerly’s guide to TradingView strategy automation walks through payload structure and webhook setup in more depth than a single article can cover, and the Pine Script primer is worth reading first if you plan to modify a public script rather than run it as-is. For background on the strategy fundamentals behind any grid configuration, Tickerly’s grid trading strategy guide covers the mechanics from a broader strategic angle.
Sources
FAQ
Does TradingView Allow Bot Trading?
TradingView doesn’t execute trades directly, but it allows alerts that can trigger external bots through webhooks, which is the standard path traders use to automate strategies including grid bots.
What Are the Best Grid Bot Configurations for TradingView?
The strongest configurations pair ATR-based spacing with auto-recenter and a defined kill switch, since fixed spacing without volatility adjustment tends to break down the moment a market trends instead of ranges.
Are Trading Bots Illegal?
Automated trading bots are legal in most jurisdictions when used on your own account through a broker or exchange that permits API access, though rules on algorithmic trading vary by country and asset class, so check your exchange’s terms and local regulations before going live.
Is There an AI Bot for TradingView?
TradingView itself doesn’t build AI trading bots, but its alert system connects to external automation platforms, including services like Tickerly, that parse those alerts and execute orders, effectively turning any TradingView strategy into a functioning bot.
How Do I Test a Grid Bot Before Trading With Real Money?
Backtest the script in TradingView’s strategy tester, validate the results in a dedicated grid simulator, then run a demo forward test through your execution bridge before committing any live capital to a small pilot position.
Recommended
This article was produced with Al assistance and reviewed for accuracy. It is provided for general information only and is not professional or financial advice.