

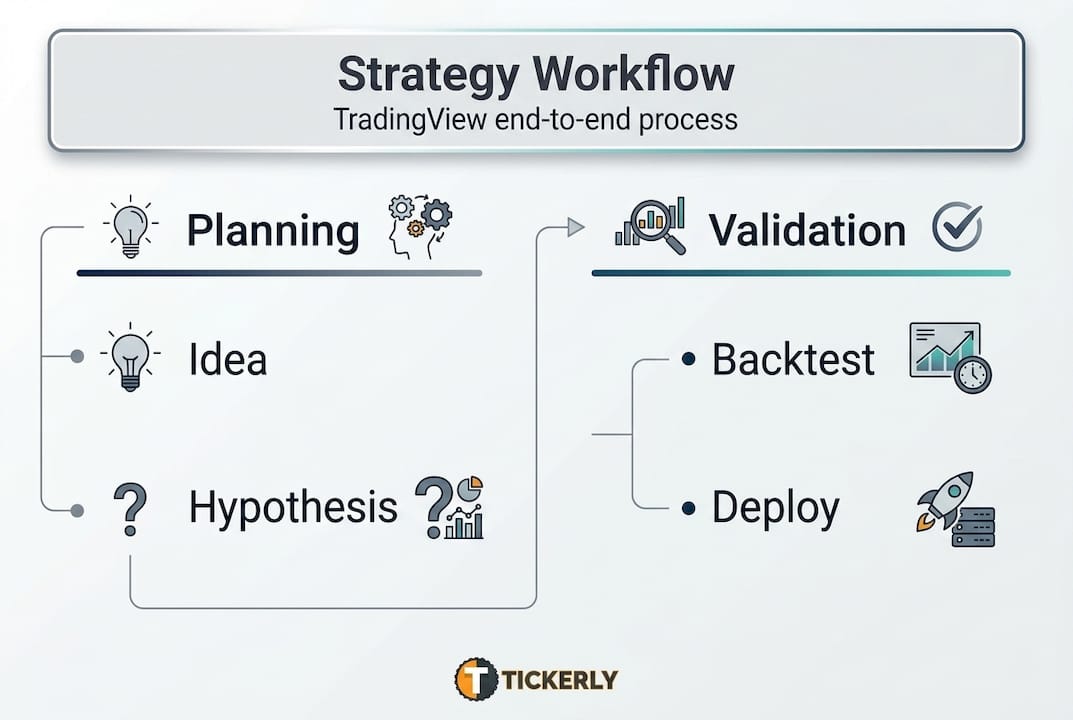
Most automated trading strategies fail not because of bad ideas, but because of a missing structure. Traders jump from concept to code to live execution without validating each stage, and the result is strategies that look great in backtests but collapse the moment real money is on the line. The trading strategy development process follows a structured workflow covering idea generation, hypothesis formulation, Pine Script coding, backtesting, and live deployment. This guide walks you through every stage with specific steps, practical tools, and the kind of expert-level guidance that separates profitable automated traders from frustrated ones.
Table of Contents
- Laying the foundation: ideas, requirements, and key tools
- From hypothesis to Pine Script: turning ideas into strategies
- Backtesting and validation: avoiding overfitting and error traps
- Performance benchmarks and live deployment readiness
- The reality behind automated trading: what most guides don’t reveal
- Take the next step: smarter automation with Tickerly
- Frequently asked questions
Key Takeaways
| Point | Details |
|---|---|
| Start with strong ideas | A well-documented idea and hypothesis are the backbone of any robust trading strategy. |
| Backtest with discipline | Thorough, cost-aware backtesting with attention to overfitting and data leakage is critical for real performance. |
| Expect live-trading gaps | Execution in live markets will always differ from backtests—monitor, adjust, and optimize continuously. |
| Benchmarks guide readiness | Profit factor, win rate, and drawdown benchmarks help set realistic expectations for strategy deployment. |
Laying the foundation: ideas, requirements, and key tools
Once you’ve decided to pursue a systematic approach, you need to gather both inspiration and the essential resources. Skipping this stage is the first major mistake most traders make. Rushing into code without a clear hypothesis produces strategies that are impossible to evaluate or improve.
Where do good strategy ideas come from? The honest answer is everywhere, as long as you apply a filter. Idea generation typically starts from one of four sources:
- Market observation: Price action patterns, session behavior, or asset correlations you notice from spending time on charts.
- Public code libraries: TradingView’s community scripts are a goldmine for identifying logic worth testing or refining.
- Academic anomalies: Published research on momentum, mean reversion, volatility clustering, and calendar effects provides tested starting points.
- Indicator-based signals: Volume spikes, RSI divergence, Bollinger Band squeezes, and candlestick formations all provide rule-based signal sources.
Before writing a single line of Pine Script, you need to assemble your full toolkit. Here’s a quick decision checklist:
| Requirement | Details to define |
|---|---|
| Asset class | Crypto, equities, forex, futures |
| Data source | TradingView data feeds, broker feeds |
| Account type | Paper trading vs. live account |
| Commission model | Percentage per trade or fixed fee |
| Session times | 24/7 crypto vs. exchange hours |
| Execution platform | TradingView + broker API via webhook |
For automating trading on TradingView, you’ll need at minimum a TradingView account (Essential plan or higher for strategy alerts), access to the Pine Script editor, and a connected broker or exchange with API support. If you want to skip the complex webhook setup, platforms like Tickerly handle that bridge automatically.
If you’re newer to the workflow, the step-by-step trading bot build process covers the full tool chain from scratch, including how to configure alerts and connect to exchanges.
Pro Tip: Document every strategy idea in a written hypothesis before opening the Pine Script editor. Include the market condition you expect the idea to work in, the logic behind the signal, and what would falsify the hypothesis. This single habit prevents you from chasing spurious patterns and saves hours of debugging later.
Getting the foundation right takes time, but every hour you invest here compounds as you move into coding and validation.
From hypothesis to Pine Script: turning ideas into strategies
With your tools and a solid idea in place, it’s time to make your plans concrete through code and clear definitions. This stage is where traders most often lose precision. Vague ideas produce unverifiable strategies, so you need to convert your market thesis into a testable, falsifiable statement before writing a single function.
A strong hypothesis sounds like this: “When the 9-period EMA crosses above the 21-period EMA during the New York session with volume 1.5x the 20-bar average, the next 4-hour candle closes positive 60% of the time.” That’s specific. It names the signal, the filter, and the expected outcome. You can test it and you can disprove it.

Manual setup vs. template-based development:
| Approach | Pros | Cons |
|---|---|---|
| Manual Pine Script from scratch | Full control, custom logic | Time-intensive, error-prone for beginners |
| Template-based development | Faster iteration, standardized structure | May limit unique logic or specialized conditions |
Once your hypothesis is written, follow this coding workflow:
- Set strategy parameters: Define commission (e.g., 0.1%), slippage (e.g., 1 tick), and initial capital inside “strategy()`.
- Define variables: Create inputs for every adjustable parameter so you can test different values without rewriting core logic.
- Code entry conditions: Use
strategy.entry("Long", strategy.long)triggered by your signal logic. - Code exit conditions: Define take-profit, stop-loss, and time-based exits explicitly. Never leave exits undefined.
- Add filters: Layer in session time restrictions, volume multipliers, and trend filters to reduce noise.
- Add risk rules: Hard-code maximum position size and daily loss limits where applicable.
For a complete breakdown of how to structure this in TradingView, the trading bot step-by-step guide covers every component of a production-ready strategy script. The TradingView scripting basics resource is also useful for getting comfortable with the Pine Script syntax before you tackle more complex logic.
Pro Tip: Use a parameter architecture that separates your strategy logic, your default input values, and your trading environment settings (commission, slippage, capital) into clearly labeled input groups. This makes updating one component without breaking another far easier, and it simplifies the handoff to anyone else reading your code.
Structured code is the difference between a strategy you can iterate on and a script you have to rewrite from scratch every time something breaks.
Backtesting and validation: avoiding overfitting and error traps
Once your strategy is coded, it’s critical to validate that it works beyond your initial dataset and doesn’t fall into common pitfalls. Backtesting is where most traders get overconfident. A beautiful equity curve in the Strategy Tester is not a license to deploy capital.
What to measure in the Strategy Tester:
| Metric | Target range | What it tells you |
|---|---|---|
| Net profit | Positive across multiple assets | Overall edge exists |
| Equity curve | Smooth, upward trend | Consistent performance |
| Max drawdown | Below 20% | Capital preservation |
| Profit factor | Above 1.0 (ideally 1.3+) | Wins outpace losses |
| Win rate | 40 to 60% | Balanced risk/reward |
Here’s a validation process you should run on every strategy before considering live deployment:
- Split your data: Use the first 70% of historical data as in-sample (IS) for development. Reserve 30% as out-of-sample (OOS) for validation.
- Run IS backtest: Optimize parameters on the IS period only.
- Test OOS without adjustments: Apply your IS-optimized parameters to the OOS period. If results collapse, you have an overfitting problem.
- Check IS/OOS performance gap: If the gap between IS and OOS net profit exceeds 20%, the strategy is likely curve-fitted and not generalizable.
- Run walk-forward analysis: Roll your test window forward across multiple periods to confirm stability across different market regimes.
- Apply to a different asset: Test the same logic on a correlated but distinct instrument. Robust edge often transfers; curve-fitted logic rarely does.
Use this trading strategy evaluation checklist to make sure you haven’t skipped a validation step before moving forward.
“Edge cases and pitfalls: Overfitting from too many parameters, IS/OOS gap greater than 20%, and high sensitivity to small input changes; look-ahead bias from repainting indicators and future data in higher timeframe calculations; ignoring costs where slippage and fees eat into edge; survivorship bias and data leakage.” Source: StockAlpha
Understanding how automated trading works at a system level also helps you anticipate where gaps between simulation and real execution appear. If you’re ready to move beyond theory, you can get started with automated trading with a tested strategy already in hand.
Never skip the OOS step. A strategy that survives the full validation process is genuinely rare, which is exactly why it’s worth trading.
Performance benchmarks and live deployment readiness
After passing validation tests, your strategy is almost ready, but understanding benchmark expectations and live-trading gaps is essential before committing real capital. Validated backtests are necessary but not sufficient for confident deployment.
Empirical benchmarks for robust strategies:
Robust strategies typically show a Sharpe ratio between 0.5 and 2.5, a profit factor above 1.3, a win rate between 40% and 60%, and a max drawdown below 20% when used as a standalone system. Hedge funds typically target Sharpe ratios between 1.0 and 2.5 for their systematic books.
Backtest results vs. live trading realities:
| Factor | Backtest environment | Live trading reality |
|---|---|---|
| Execution | Instant, perfect fills | Partial fills, queue position |
| Slippage | Fixed estimate | Variable, asset/time dependent |
| Latency | Zero | WebSocket delays, API lag |
| Data quality | Clean historical bars | Gaps, ticks, feed anomalies |
| Broker behavior | Idealized | Rules, margin calls, downtime |
Statistic callout: A Sharpe ratio above 3.0 in a backtest often signals overfitting, not exceptional skill. Real-world conditions systematically reduce Sharpe by 30 to 50% compared to backtested values.
Before you hit the deploy button, run through this live readiness checklist:
- Confirm your strategy uses non-repainting indicators only.
- Verify stop-loss and take-profit orders are placed at the broker level, not just in Pine Script logic.
- Test your alert webhook delivery with a paper trading account first.
- Set position sizing to a fraction of your intended live size for the first 30 trading days.
- Establish monitoring alerts for drawdown thresholds and missed signal events.
Live trading reveals execution gaps including WebSocket drops, partial fills, and latency that consistently exceeds backtest assumptions. The most effective approach is to start small, use regime filters (such as restricting trades to high-volatility or high-volume conditions), and separate your parameter architecture into logic, defaults, and environment settings for easier maintenance.
For guidance on deploying autotrading strategies and understanding the technical requirements of live execution, it helps to review the full workflow from signal to order. If you’re scaling into algo trading with TradingView, understanding these deployment gaps upfront prevents costly surprises in the first weeks of live trading.
The reality behind automated trading: what most guides don’t reveal
Most strategy development guides stop at the backtesting phase and imply that a validated strategy is a solved problem. It isn’t. The gap between a clean backtest and consistent live performance is the part of automated trading that catches experienced traders off guard.
The core issue is that backtests model the past with perfect information. Live markets are messy. Execution gaps such as WebSocket disconnections, partial fills, and latency above what you modeled in testing are not edge cases. They are routine. The traders who handle them well are the ones who plan for them before deployment, not after their first losing week.
The second reality is maintenance. Automated strategies are not static systems. Markets evolve, volatility regimes shift, and correlation structures change. A strategy that performs well during a trending bull market may produce significant drawdowns in a choppy, low-volume environment. Regular audits on a monthly or quarterly schedule, combined with version control for every code change, allow you to identify regime-driven performance shifts before they become account-threatening problems.
The third reality is mindset. The best systematic traders we observe treat every deployment as an experiment with a defined hypothesis and a pre-set review schedule. They document performance deviations, investigate root causes, and iterate on the code with discipline. They don’t panic when a strategy enters a drawdown within expected parameters, and they don’t double position size after a hot streak.
You can explore long-term approaches to long-term trading optimization to build the kind of iterative review process that keeps strategies performing across different market conditions.
Pro Tip: Never “set and forget” any automated bot, regardless of how strong the backtest looked. Build a monitoring routine that checks equity curve health, win rate deviation, and average trade duration on a weekly basis. If any metric drifts more than 15% from backtest averages over a rolling 20-trade window, pause the bot and review before continuing.
The most durable edge in systematic trading comes not from perfect code, but from the discipline to monitor, adapt, and stay honest about what your strategy is actually doing in the market.
Take the next step: smarter automation with Tickerly
Put these principles into action with the right tools and support.

Building a validated strategy is one thing. Deploying it reliably in live markets is another. Tickerly is built specifically to bridge that gap for TradingView traders. With Tickerly, your Pine Script strategy signals become real automated orders on your connected exchange or broker, without manual intervention and without complex API coding on your part. You can explore algo trading solutions that fit your strategy’s specific logic, browse view proven strategies for inspiration and testing benchmarks, or work through the automated trading FAQ to resolve common deployment questions. Tickerly handles the execution infrastructure so you can focus on building and refining your edge.
Frequently asked questions
What’s the biggest mistake traders make in the strategy development process?
Overfitting by using too many parameters or not testing strategies out-of-sample is the most common and costly mistake, producing strategies that look exceptional historically but fail in live markets.
How do I avoid look-ahead bias when backtesting automated strategies?
Always use non-repainting indicators and verify your strategy only references data available at each completed bar. Look-ahead bias from repainting indicators and higher timeframe data errors are among the most common sources of inflated backtest results.
What benchmarks indicate a robust automated strategy?
A profit factor above 1.3, win rate between 40% and 60%, and max drawdown below 20% are the primary indicators of a strategy with genuine edge and practical viability for live trading.
How should I handle slippage and commissions in strategy testing?
Include realistic estimates for both in every backtest. Commissions at 0.1% and slippage of at least 1 tick should be standard inputs, because ignoring these costs systematically inflates your backtested net profit.
Why do live results differ from backtests in automated trading?
Live trading execution gaps including latency, partial fills, WebSocket drops, and variable slippage are not modeled in historical simulations, which is why starting small and monitoring closely in the first weeks of live deployment is critical.