

Most traders assume that feeding more historical data into a trading algorithm automatically produces better results. That assumption is wrong, and it costs real money. The truth is that data quality, proper validation, and contextual application matter far more than raw volume. Every stage of algorithmic trading, from defining your rules to executing live orders, depends on how well you understand and handle your data. This guide breaks down exactly how data shapes algorithmic performance, where it can deceive you, and how TradingView traders can build strategies that hold up in live markets.
Table of Contents
- How data forms the backbone of algorithmic trading
- Data quality vs. quantity: What really drives performance
- Hidden risks and limitations: When data deceives
- Practical tips for leveraging data in TradingView strategies
- The uncomfortable truth about data-driven trading
- Take your TradingView automation further with Tickerly
- Frequently asked questions
Key Takeaways
| Point | Details |
|---|---|
| Data is algorithmic trading’s foundation | High-quality data drives all aspects of profitable algorithmic strategies, from signal generation to execution. |
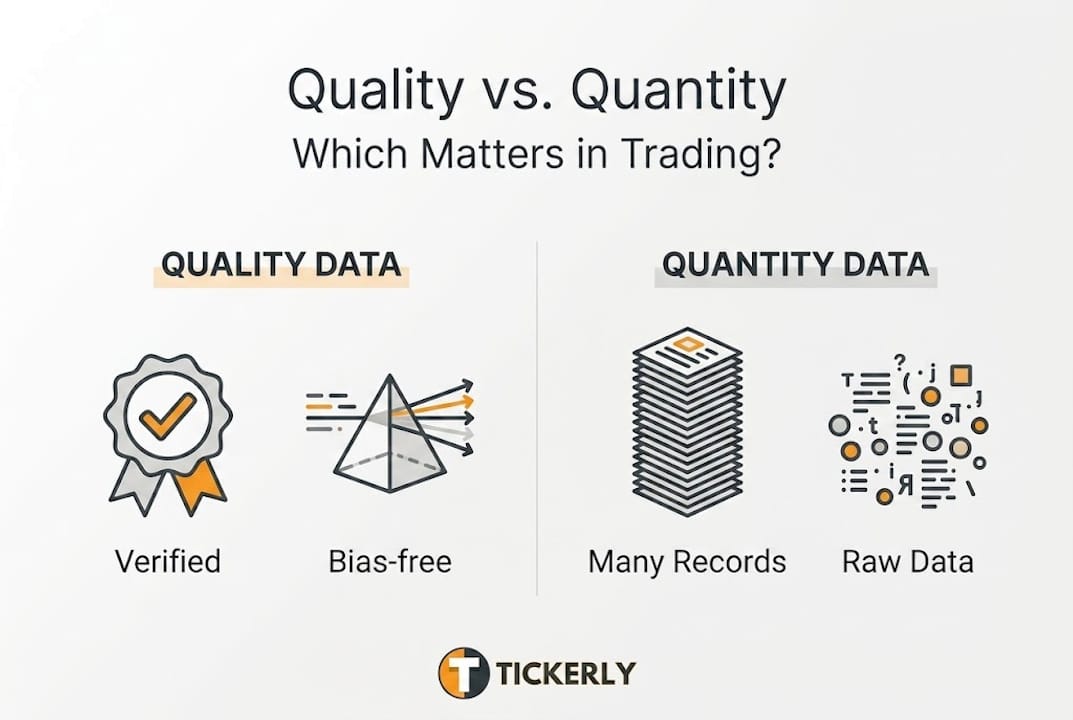
| Quality matters more than quantity | Robust, adjusted, and bias-free data consistently outperforms massive but noisy datasets. |
| Beware systemic risks | Even the best models can fail during market stress or if built on poor-quality data or backtests. |
| Apply best practices in TradingView | Use validated data sources, test across regimes, and automate risk controls for safer, smarter trades. |
How data forms the backbone of algorithmic trading
Understanding algorithmic trading basics starts with recognizing that data is not just an input. It is the entire foundation upon which every decision is made. Without structured, reliable data, an algorithm has nothing to act on.
Trading algorithms consume several distinct types of data, each serving a specific purpose:
| Data type | What it captures | Primary use case |
|---|---|---|
| Price data (OHLCV) | Open, high, low, close, volume | Trend and momentum signals |
| Order book (Level 2/3) | Bid/ask depth, order flow | Market microstructure analysis |
| News and sentiment | Headlines, social signals | Event-driven strategies |
| Alternative data | Satellite imagery, web traffic | Edge discovery in equities/crypto |
| Macroeconomic data | Interest rates, GDP, CPI | Regime identification |
Each data type feeds into a specific layer of the algorithm’s logic. Price and volume data drive most retail strategies built in Pine Script on TradingView. Order book data, particularly Level 2 and Level 3 feeds, becomes critical for high-frequency and market-making strategies where milliseconds and queue position determine profitability.
The pipeline from raw data to actionable signal follows a consistent pattern:
- Raw ingestion: Data arrives from exchanges, data vendors, or news APIs
- Cleaning and normalization: Removing outliers, adjusting for splits and dividends, handling missing bars
- Feature engineering: Converting raw data into indicators like RSI, VWAP, or Bollinger Bands
- Signal generation: Rules fire when conditions align across multiple indicators or data streams
- Execution routing: Orders are sent through APIs with defined parameters for size, price, and timing
“Data serves as the foundational input for algorithmic trading, enabling the definition of trading rules, generation of signals, backtesting of strategies, and real-time execution decisions through quantitative models and mathematical analysis.”
The reason data is so critical at every stage is that algorithms have no intuition. They cannot sense that a market is behaving unusually or that a news event just changed the macro picture. Every adjustment must come from data. A strategy that ignores order flow, for example, might generate a buy signal right into a wall of sell orders, producing slippage that destroys the theoretical edge entirely. This is why understanding your data pipeline is not optional. It is the difference between a strategy that performs in backtesting and one that survives contact with real markets.

Data quality vs. quantity: What really drives performance
Now that the foundational role is clear, it is worth examining why data quality consistently outperforms data quantity, and how this plays out in practice with concrete consequences.
The most dangerous trap in algorithmic trading is survivorship bias. When you build a strategy using a dataset that only includes assets still trading today, you are excluding all the assets that failed, got delisted, or went to zero. Your backtest looks fantastic because you are only testing against survivors. In reality, your live strategy would have held positions in assets that no longer exist.
Adjusted data presents a similar challenge. When a stock splits 2-for-1, unadjusted historical data shows a sudden 50% price drop that never actually happened. An algorithm trained on unadjusted data will interpret that as a crash signal and generate false entries or exits. Properly adjusted data corrects for splits, dividends, and corporate actions so your indicators reflect actual price behavior.
Comparison: High-quality data vs. high-quantity data
| Factor | High-quality data | High-quantity data |
|---|---|---|
| Accuracy | Cleaned, adjusted, verified | Often raw, unverified |
| Bias risk | Low (survivorship-free) | High (includes delisted assets) |
| Backtest reliability | Strong | Misleading |
| Live performance | Consistent | Frequently degrades |
| Storage and processing | Manageable | Resource-intensive |
Overfitting is the most common consequence of prioritizing quantity over quality. A strategy that achieves a Sharpe ratio above 3.0 in backtesting is almost always overfit. Real-world reliable backtesting shows that strategies achieving Sharpe ratios of 1.5 to 3.0 live, with examples like a +149% out-of-sample return and Sortino ratio of 2.87 in walk-forward analysis, represent genuine edge. High in-sample Sharpes above 3.0 are a red flag, not a green light.
Steps to safeguard your data usage in algorithmic trading:
- Source data from reputable providers with documented adjustment methodologies
- Check for and remove survivorship bias before running any historical analysis
- Verify that your data covers multiple market regimes, not just bull markets
- Normalize volume data across different time periods to account for liquidity changes
- Cross-validate your data against a second independent source before deploying capital
Pro Tip: Always test your algorithm across at least three distinct market conditions: a sustained uptrend, a prolonged downtrend, and a high-volatility sideways period. A strategy that only performs in one regime is not robust. It is just lucky.
The bottom line is that one year of clean, bias-free, properly adjusted data will produce more reliable strategies than five years of raw, unverified data. Quality is not a nice-to-have. It is the single most important variable in your data pipeline.
Hidden risks and limitations: When data deceives
Understanding data’s strengths leads directly to its weaknesses. Even with clean, high-quality data, your algorithm faces risks that no amount of historical information can fully prepare you for.
The most significant structural risk is model brittleness during regime changes. An algorithm trained on 2021 crypto bull market data will have learned patterns that simply do not exist in a 2022 bear market. When the regime shifts, the model’s signals become noise. Worse, the algorithm often increases position size right as conditions deteriorate because its confidence metrics are still calibrated to the old regime.
Three data-related trading disasters that illustrate these risks:
- The 2010 Flash Crash: High-frequency algorithms withdrew liquidity simultaneously, causing the Dow to drop 9% in 36 minutes as models encountered data patterns outside their training distribution
- Long-Term Capital Management (1998): Quant models built on historical correlations broke down during the Russian debt crisis, a true black swan event that the data had never seen
- Knight Capital (2012): A software error caused the algorithm to execute 4 million trades in 45 minutes, generating a $440 million loss because the system had no circuit breaker to detect anomalous execution behavior
“Edge cases include black swan events where models fail due to unprecedented data, leading to flash crashes like 2010; overfitting drops performance from +20% to -1%; data quality issues like noise and non-stationarity compound these failures.”
Non-stationarity is another hidden threat. Financial time series are not stationary, meaning their statistical properties change over time. A mean-reversion strategy that worked perfectly when volatility was low will generate catastrophic losses when volatility spikes. Your historical data cannot warn you about this shift in advance. The model simply does not know what it does not know.
Using TradingView for robust backtesting helps you identify these fragility points before they cost you capital. But backtesting alone is never enough.
Pro Tip: Always use walk-forward or out-of-sample validation before deploying any strategy live. Split your historical data into at least three segments: training, validation, and out-of-sample test. If the strategy degrades significantly in the test segment, it is overfit and not ready for live trading.
The crowding problem is equally dangerous. When many algorithms use the same data sources and similar logic, they generate correlated signals. In a stress event, they all try to exit at the same time, amplifying price moves and destroying the liquidity assumptions baked into their backtests. Your algorithm’s edge can evaporate not because your data was wrong, but because everyone else had the same data.
Practical tips for leveraging data in TradingView strategies
With caution on pitfalls established, here is hands-on guidance for TradingView traders who want to harness quality data safely and build strategies that perform in live markets.
The first decision is where to source your data. TradingView provides excellent price and volume data directly within the platform, covering equities, crypto, forex, and futures. For crypto-specific strategies, accessing advanced order book data from major exchanges gives you a significant edge, particularly for strategies that depend on liquidity analysis or market microstructure signals.
Step-by-step process for integrating quality data into TradingView:
- Select your data source: Use TradingView’s built-in feeds for price/volume; connect exchange APIs for order book data
- Define your adjustment policy: Decide upfront whether you will use adjusted or unadjusted data and apply it consistently across all backtests
- Set your lookback period: Include at least one full market cycle (bull and bear) in your historical data window
- Apply regime filters: Add a volatility regime indicator (ATR-based or VIX-equivalent) to your strategy so signals are filtered by market condition
- Run multi-seed validation: Test your strategy with different random seeds and starting dates to confirm results are not noise-fitting
- Stress test with synthetic data: Inject simulated flash crash scenarios or liquidity gaps to see how your algorithm responds
The adjusted vs. unadjusted data debate matters most for crypto strategies. Crypto assets do not have dividends or stock splits, but they do have funding rate payments, token migrations, and exchange-specific price discrepancies. Expert nuances emphasize low-latency exchange data including Level 3 order-by-order feeds for HFT edge, regime-adaptive strategies, and multi-seed validation to avoid noise-fitting. For most TradingView traders, using the exchange’s native price feed with volume confirmation is the right starting point.
Essential risk controls to build into every data-driven strategy:
- Hard stop-loss: A fixed percentage or ATR-based stop that closes the position regardless of signal state
- Position sizing rules: Limit each trade to a fixed percentage of total capital, typically 1 to 2 percent per position
- Event filters: Pause trading during scheduled high-impact news events like FOMC announcements or CPI releases
- Drawdown circuit breaker: Automatically halt trading if the strategy exceeds a defined drawdown threshold within a rolling period
- Liquidity checks: Avoid entering positions when volume is significantly below the historical average for that time period
Risk management automation is where the gap between manual and automated trading becomes most visible. A human trader might override a stop-loss out of hope. An automated system executes it without hesitation, protecting your capital when data conditions deteriorate.
The uncomfortable truth about data-driven trading
Here is what most guides on algorithmic trading will not tell you: the more traders rely on the same data and similar models, the more fragile the overall market becomes. This is not a theoretical concern. It is a structural reality that gets more pronounced as algorithmic participation increases.
Conventional wisdom says more data and better models equal better performance. But when thousands of algorithms share the same data sources, the same signals, and the same logic, their behavior becomes tightly coupled. In normal conditions, this looks like efficiency. In stress conditions, it looks like a systemic failure cascade, where individual risk management practices that seem sound in isolation actually worsen market instability when executed simultaneously.
Machine learning models amplify this problem. A deep learning model trained on five years of tick data can identify patterns no human would spot. It can also overfit to noise in ways that are invisible until the model goes live. The confidence metrics look perfect. The out-of-sample results look solid. Then a regime shift happens, and the model’s learned patterns simply stop working.
The traders who survive long-term are not those with the most data or the most sophisticated models. They are the ones who build in behavioral safeguards: circuit breakers that halt trading when conditions fall outside the model’s training distribution, position limits that prevent crowding into correlated trades, and genuine humility about what historical data can and cannot predict. Adaptive thinking, not more data, is the real edge.
Take your TradingView automation further with Tickerly
If you are serious about applying these data principles to live trading, the next step is connecting your TradingView strategies to a system that executes them with precision and speed.
Tickerly is built specifically for TradingView traders who want to move from manual execution to fully automated trading bots. You can connect your Pine Script strategies directly to major exchanges through Tickerly’s API integrations, applying all the risk controls and data-driven logic you have built in TradingView. Explore automating TradingView strategies with Tickerly’s platform, or browse proven strategies to see how other traders are putting quality data to work in live markets right now.
Frequently asked questions
What types of data are most important for algorithmic trading?
Price, volume, and order book (Level 2/3) data are most critical because they directly drive trading rule definition and signal generation, though news and alternative data can add meaningful edge in specific strategy types.
How does data quality impact algorithm performance?
High-quality, bias-free data produces strategies with consistent live results, while noisy or survivorship-biased data leads to overfitting; empirical benchmarks show live Sharpe ratios of 1.5 to 3.0 represent genuine edge, not in-sample ratios above 3.0.
What is overfitting in algorithmic trading, and how can it be avoided?
Overfitting occurs when a strategy is tuned so precisely to historical data that it fails in live markets, often dropping performance from +20% to negative; avoid it through strict out-of-sample testing and walk-forward validation before any live deployment.
Why do algorithmic models fail during extreme market events?
Models fail during black swan events because the underlying data patterns are entirely outside the training distribution, as seen in the 2010 Flash Crash where mass HFT withdrawal caused a 9% Dow drop in under 40 minutes.