

TradingView scripts are not just for developers with years of coding experience. Any trader willing to spend a few hours learning Pine Script can automate chart analysis, build custom indicators, and run backtests without writing a single line of complex code. Pine Script v6, the current version, is purpose-built for traders, not software engineers. In this guide, you will learn exactly how TradingView scripts work, how to avoid the most common mistakes, and how to get better results from your automated strategies.
Table of Contents
- Understanding TradingView scripts and Pine Script v6
- How TradingView scripts execute: historical and realtime data
- Indicators vs strategies: visualizing, backtesting, and performance metrics
- Pitfalls and limitations: repainting, history caps, and testing methods
- Why TradingView scripting is both powerful and imperfect
- Ready to automate your TradingView scripts?
- Frequently asked questions
Key Takeaways
| Point | Details |
|---|---|
| Pine Script powers automation | TradingView scripts use Pine Script v6 to automate analysis, alerts, and backtesting. |
| Execution differs by mode | Scripts handle historical and realtime bars differently, affecting strategy outcomes. |
| Performance metrics matter | Profit factor, drawdown, and win rate help traders measure script effectiveness. |
| Repainting is a key pitfall | Avoiding repainting requires careful coding and confirmed bar data. |
| Upgrade for advanced automation | TradingView is great for prototyping, but power users often migrate to professional platforms. |
Understanding TradingView scripts and Pine Script v6
Pine Script is a domain-specific language created exclusively for TradingView. Its entire design philosophy is centered on making it fast and practical to build trading tools directly on the chart. You are not writing general-purpose software. You are writing logic that interacts with price data, time series, and market conditions.
Pine Script v6 is the most capable version yet. It introduces cleaner syntax, improved type handling, and better support for complex strategy logic. Whether you are building a simple moving average crossover or a multi-condition entry filter, v6 gives you the tools to do it cleanly.
There are two primary script types you need to understand:
| Script type | Primary use | Output |
|---|---|---|
| Indicator | Visualization on chart | Plots, labels, shapes |
| Strategy | Backtesting and automation | Entry/exit orders, performance report |
Indicators display information visually. They do not place trades. Strategies simulate order execution and generate performance reports. Knowing which type to use is the first decision you make when writing any script.
Some of the most useful built-in functions in Pine Script v6 include:
- ta.sma(source, length): Calculates a simple moving average over a defined period
- ta.rsi(source, length): Returns the Relative Strength Index for momentum analysis
- ta.ema(source, length): Exponential moving average, more responsive to recent price changes
- request.security(): Pulls data from other timeframes or symbols into your script
- strategy.entry() / strategy.exit(): Places and manages simulated trade orders
These functions operate on series data, meaning every value is a sequence of historical data points indexed by bar. This is what makes Pine Script both powerful and unique compared to general scripting languages.
Who benefits most from learning Pine Script? Beginners gain access to custom indicators without needing third-party tools. Experienced traders can build rule-based systems that remove emotion from decision-making. For a deep dive into TradingView tools and how they support automation, it is worth exploring the full range of capabilities available on the platform.
How TradingView scripts execute: historical and realtime data
Understanding how your script actually runs is critical to getting reliable results. There is a meaningful difference between how scripts process historical data and how they handle live market conditions.
Scripts execute sequentially on historical bars, processing one bar at a time from left to right. On realtime bars, the script runs multiple times per price update, recalculating on every tick until the bar closes. This distinction matters enormously for automation.
Here is a direct comparison of the two execution contexts:
| Execution context | Frequency | Primary use case |
|---|---|---|
| Historical bars | Once per bar | Backtesting strategy logic |
| Realtime bars | Multiple times per update | Live alerting and automation |
The data model underpinning both contexts is OHLCV: Open, High, Low, Close, and Volume. Every bar in TradingView is represented by these five values. Your script accesses them as series, meaning you can reference past values using bracket notation like "close[1]` for the previous bar’s closing price.
Here is the typical execution flow for a strategy script:
- Script loads all available historical bars from left to right
- Conditions are evaluated bar by bar using OHLCV series data
- Entry and exit logic fires when conditions are met
- Strategy tester records all simulated trades and generates metrics
- On the live bar, the script recalculates in real time as new ticks arrive
- Alerts trigger when conditions are confirmed on bar close
One practical implication: a signal that appears on a realtime bar may disappear or change before the bar closes. This is the root cause of many inconsistencies traders notice between their backtest and live results.
Pro Tip: Always compare your backtest signals against live bar behavior using TradingView’s Bar Replay feature. If signals shift between open and close of the same bar, your logic may be triggering too early. Building your step-by-step trading bot on confirmed bar data will give you far more reliable results.
Indicators vs strategies: visualizing, backtesting, and performance metrics
Once you understand how scripts execute, the next step is knowing how to measure whether your strategy actually works. This is where performance metrics become essential.
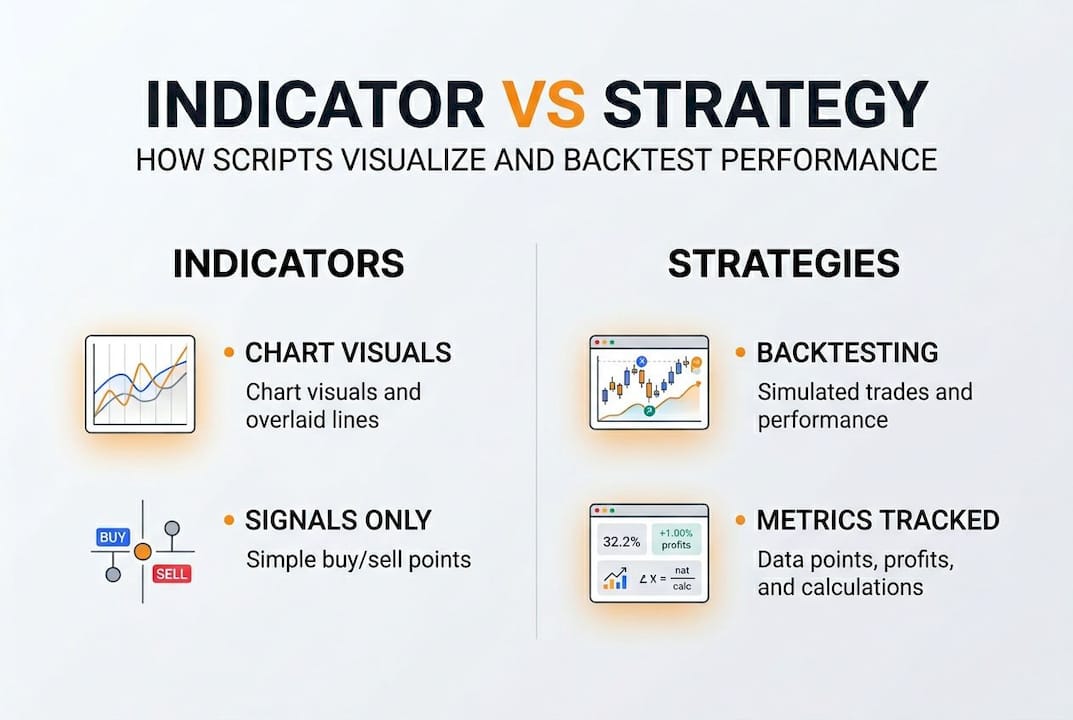
Indicators are purely visual. They plot lines, shapes, and labels on your chart to help you interpret price action. They do not interact with the strategy tester and cannot generate trade reports. Strategies, on the other hand, simulate real order execution. Every strategy.entry() and strategy.exit() call creates a simulated trade that feeds into the performance report.
The metrics that matter most when evaluating a strategy script:
- Profit factor: Total gross profit divided by total gross loss. A profit factor above 1.5 is generally considered good, with annual returns above 15% and max drawdown below 30% as healthy benchmarks
- Win rate: Percentage of trades that close profitably. Higher is not always better without context
- Max drawdown: The largest peak-to-trough equity decline. Keeping this below 30% is a common threshold for sustainable strategies
- Net profit: Total return over the tested period, expressed in currency or percentage
- Sharpe ratio: Risk-adjusted return. Higher values indicate better return per unit of risk taken
| Metric | Healthy benchmark | Red flag |
|---|---|---|
| Profit factor | Above 1.5 | Below 1.0 |
| Max drawdown | Below 30% | Above 50% |
| Annual return | Above 15% | Below 5% |
| Win rate | Context-dependent | Paired with poor profit factor |
A momentum strategy backtest covering 2005 to 2025 showed 2596% profit with an 81.5% win rate. Those numbers look extraordinary, but they also illustrate the danger of overfitting. When a strategy is tuned too tightly to historical data, it performs brilliantly on past bars and fails completely on live data.
To avoid overfitting, split your historical data into in-sample and out-of-sample periods. Optimize on the first half and validate on the second. You can explore the TradingView strategy library for real-world examples, and read more about optimizing trading strategies for long-term performance.
Pitfalls and limitations: repainting, history caps, and testing methods
Even well-written scripts can produce misleading results if you are not aware of the technical limitations built into TradingView’s environment.
Repainting is the most common and damaging issue. It occurs when a script recalculates past values based on current data, making historical signals look better than they actually were. To prevent repainting, use close[1] instead of close, apply barstate.isconfirmed to ensure logic only fires on closed bars, and set barmerge.lookahead_off inside request.security() calls.
Pro Tip: Make barstate.isconfirmed a standard part of every alert condition you write. It is a single line that eliminates an entire category of false signals.
Other key limitations to know:
- History caps: The number of bars available for backtesting depends on your TradingView plan. Free accounts get fewer bars, which can limit how far back your backtest reaches
- No direct trade execution: Pine Script cannot send orders to a broker on its own. It generates alerts, which then need to be routed through an external service
- No true tick data: Historical data in TradingView is bar-based, not tick-based. This means high-frequency strategies cannot be accurately backtested in this environment
- Computational limits: Scripts have memory and calculation caps. Complex strategies with many indicators can hit these limits
“Pine Script has no direct trading execution, computational caps, and no true tick data historically, which contrasts sharply with full trading platforms like Python-based systems.”
For testing live behavior, use TradingView’s Bar Replay tool to simulate realtime conditions on historical data. Refresh the page after adding a script to ensure you are seeing the most current calculation. And always run a live paper trading period before committing real capital to any automated trading solutions built on your script logic.
Note that no universal performance benchmarks exist across all strategies and markets. What works on crypto may fail on equities. Context always matters.
Why TradingView scripting is both powerful and imperfect
Here is the honest take: Pine Script is the best entry point for traders who want to automate without switching careers. Its syntax is readable, the feedback loop is immediate, and you can go from idea to backtest in under an hour. That speed of iteration is genuinely hard to replicate anywhere else.
But Pine Script has a ceiling. When you need tick-level data, deep multi-decade history, or direct API execution with sub-second latency, you will eventually hit that ceiling. The traders who stay frustrated are the ones who try to force Pine Script to do things it was never designed for. The traders who succeed treat it as a rapid prototyping layer, not a production execution engine.
As Pine Script’s limitations make clear, it is excellent for beginners and visual traders but falls short for professionals who need deep history or tick data. Our perspective: use TradingView for what it does best, which is fast visualization and strategy validation, and then route your confirmed signals through a purpose-built automation layer. That combination gives you the speed of mastering TradingView automation with the reliability of a proper execution system. Do not let Pine Script’s limits become your bottleneck.
Ready to automate your TradingView scripts?
You have built the knowledge foundation. Now it is time to put it to work. Tickerly turns your TradingView strategies into fully automated trading bots, bridging the gap between Pine Script signals and real order execution.
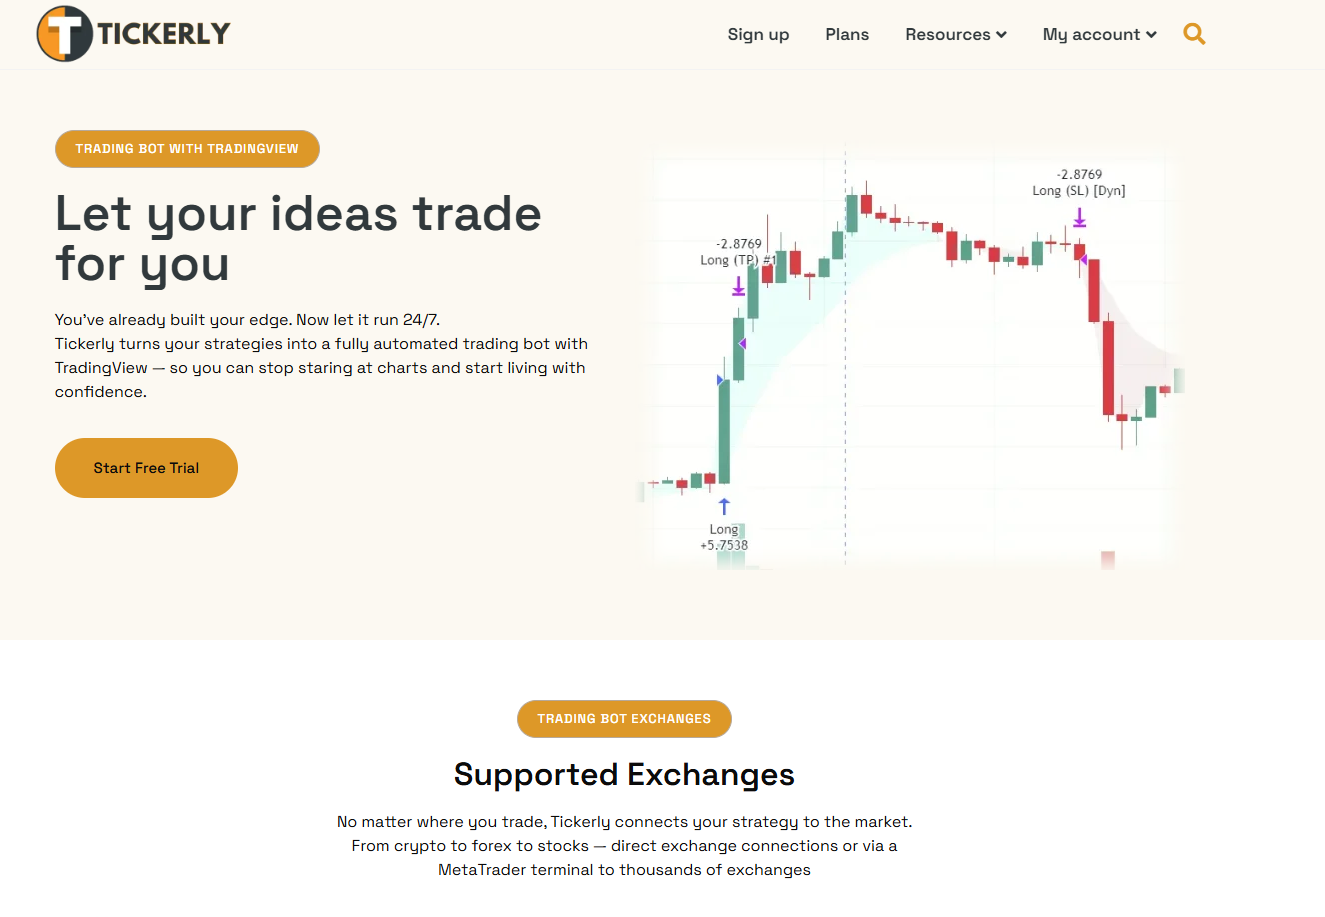
Whether you are just getting started with algotrading solutions or looking to scale a proven system, Tickerly gives you the infrastructure to act on your signals instantly. Browse our strategy resources to find tested frameworks, or follow our step-by-step guide to automate TradingView trading using Tickerly. Your script already does the analysis. Let automation handle the execution.
Frequently asked questions
What is Pine Script and how is it used in TradingView?
Pine Script is a domain-specific language for creating custom indicators and strategies, enabling traders to automate chart analysis and backtesting directly within TradingView.
How do TradingView scripts execute on historical and live bars?
Scripts run sequentially on historical bars once per bar for backtesting, and recalculate multiple times per update on realtime bars using OHLCV series data.
How can I avoid repainting errors when automating my trading scripts?
Use close[1], barstate.isconfirmed, and barmerge.lookahead_off to ensure your script only acts on fully confirmed bar data, eliminating retroactive signal changes.
What performance metrics should I track with TradingView strategies?
Focus on profit factor, max drawdown, annual return, and win rate. A profit factor above 1.5 with drawdown below 30% is a solid baseline for evaluating strategy health.
Are TradingView scripts sufficient for professional trading automation?
They excel at rapid prototyping and visual automation, but lack direct execution and true tick data, which means serious algo traders often need to pair them with external execution platforms.