

Day traders rely on six primary breakout types: opening-range breakouts (ORB), momentum/pre-market-high breakouts, consolidation and pattern breakouts (triangles, flags, channels, head and shoulders, cup and handle), channel breakouts, VWAP breakouts, and gap-and-go breakouts. Each serves a distinct intraday purpose. ORBs and gap-and-go setups suit scalpers working the first 30 minutes. Pattern and channel breakouts fit trend-capture trades on the 15-minute chart. VWAP breakouts work for both continuation and mean-reversion plays throughout the session.
Before entering any of these setups, three confirmation rules apply across the board:
- Tight base: price consolidates in a narrow range before the break, reducing noise and tightening your stop.
- Clear level: the breakout level is unambiguous — a prior high, a range boundary, or a VWAP line — not a subjective guess.
- Expanding volume: the breakout bar carries noticeably higher volume than the bars inside the consolidation, confirming real order flow behind the move.
Miss any one of these and you are trading a lower-probability setup.
Key Takeaways
Breakout trading in day trading produces consistent results only when timeframe, confirmation, and risk rules are applied together — not in isolation.
| Point | Details |
|---|---|
| Match timeframe to hold time | Use 1-min for scalps, 5-min for 15–30 min holds, 15-min for 30–90 min trend trades. |
| Three confirmation rules | Every intraday breakout needs a tight base, a clear level, and at least 1.5x the average volume of the consolidation bars on the breakout bar. |
| Entry/stop/target discipline | Size positions to 0.5% account risk; target at least 1:2 R:R; trail stop to breakeven at 1:1. |
| Fakeout filters | Require a full candle close outside the level; avoid breakouts against the 15-min trend or near news events. |
| Tickerly automates execution | Tickerly converts TradingView breakout alerts into live orders with fast execution across multiple symbols simultaneously. |
Table of Contents
- What does a breakout mean in a day-trading context?
- What are the main day trading breakout types?
- How do pattern-based breakouts work on intraday charts?
- How do time-based intraday breakout setups work?
- Which indicators confirm an intraday breakout?
- How do you set entries, stops, and targets for breakout trades?
- How do you recognize and avoid breakout fakeouts?
- Three step-by-step intraday breakout trade examples
- When should you automate your breakout strategy?
- An honest take on how breakout trading actually works
- Tickerly turns your breakout rules into live automated trades
- Sources
- FAQ
What does a breakout mean in a day-trading context?
A breakout, in intraday terms, is the first clean move outside a well-defined consolidation on your chosen timeframe. TradingSim defines high-probability intraday breakouts by exactly those three traits: a tight base, a clear level, and a volume surge on the breakout bar. The consolidation can last five minutes or two hours — what matters is that price has built a recognizable boundary that the market then violates with conviction.
The mechanics behind why breakouts produce tradable moves come down to order imbalance. When price breaks a well-watched level, resting stop orders above resistance (or below support) get triggered. That stop-run creates a burst of market orders in one direction, expanding volatility and giving a skilled trader a momentum edge. Without that order-flow dynamic, a “breakout” is just random noise.
Three traits consistently separate high-probability intraday breakouts from low-probability ones:
- Tight base: a narrow consolidation compresses energy and keeps your stop small.
- Clear, well-watched level: the more traders watching the same line, the more stops cluster there and the more powerful the break.
- Volume and momentum confirmation: IG International notes that breakouts treated as a statistical edge require volume or momentum context plus strict stop management, because without supporting volume they fail at a high rate.
Pro Tip: Match your timeframe to your intended hold time. Scalpers working 5–10 minute holds should use the 1-minute chart for entries and the 5-minute for context. Traders targeting 30–60 minute moves should anchor to the 15-minute chart and use the 5-minute only for entry timing.
What are the main day trading breakout types?
Day traders organize breakouts into two broad categories — continuation and reversal — and two structural sub-categories: pattern-based and time-based.
Continuation vs. reversal is the most important distinction. A continuation breakout fires in the direction of the prevailing intraday trend: a bull flag breaking higher, a triangle resolving upward in an uptrend. Confirmation requirements are lighter because the trade aligns with existing momentum. A reversal breakout (head and shoulders, double top/bottom) fires against the prior trend and demands stronger confirmation: heavier volume, a confirmed retest, and ideally a shift in the broader market structure.
Backtested data from Excavo shows that range breakouts and channel breakouts perform differently across timeframes, with range breakouts tending to work better on 15-minute and 4-hour charts while channel breakouts favor the 1-hour. Timeframe choice is not cosmetic — it materially affects breakout quality and win rate.
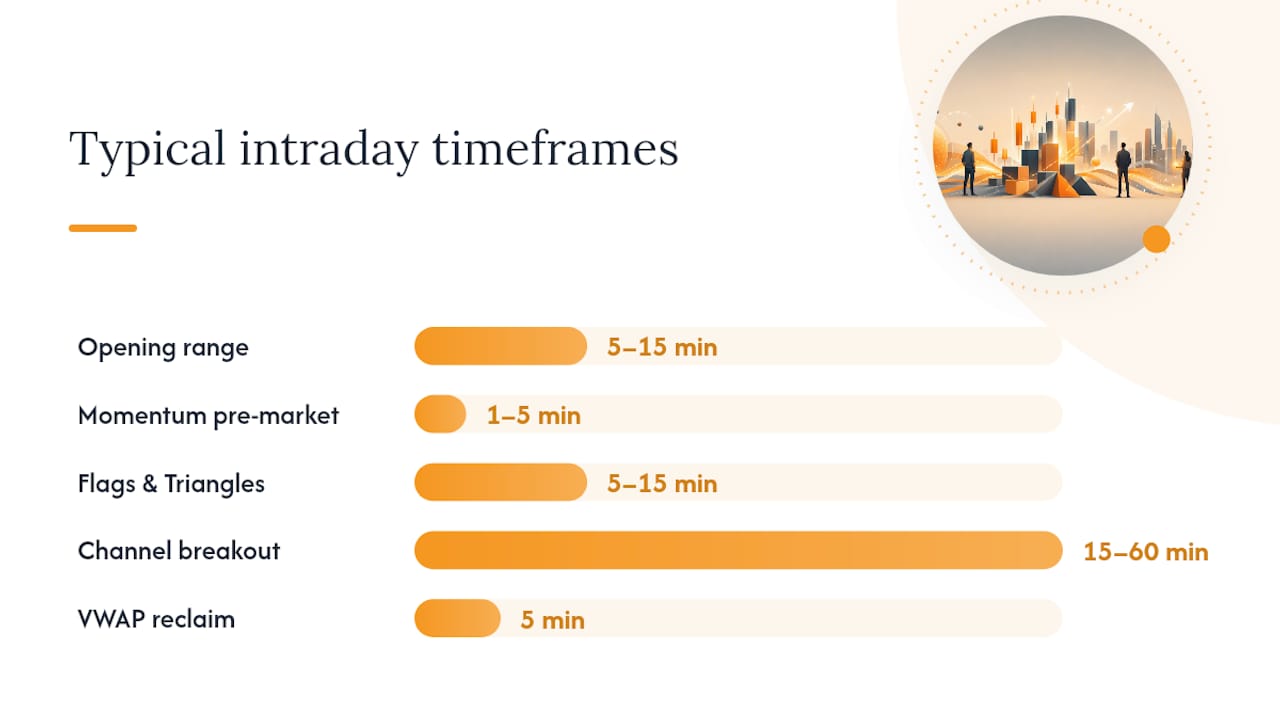
The table below maps the primary breakout families to their typical intraday context:
| Category | Typical Timeframe | Confirmation Needed | Use Case |
|---|---|---|---|
| Opening-range breakout (ORB) | 5-min / 15-min | Volume surge + range expansion | Scalp or trend capture at open |
| Momentum / pre-market-high | 1-min / 5-min | Pre-market volume + gap size | Gap-and-go scalp |
| Pattern-based (flags, triangles) | 5-min / 15-min | Volume on breakout bar + pattern integrity | Continuation or reversal trade |
| Channel breakout | 15-min / 1-hour | Close outside channel + volume | Trend capture, longer hold |
| VWAP breakout / reclaim | 5-min | Price close above/below VWAP + volume | Intraday trend confirmation |
| Gap-and-go | 1-min / 5-min | Pre-market volume + news catalyst | Momentum scalp at open |
One-line recognition guide:
- ORB: first 15–30 minutes sets the range; trade the break of that range’s high or low.
- Gap-and-go: stock opens above prior close with pre-market volume; enter on the first 1-minute candle close above the opening candle.
- Flag/pennant: sharp move followed by tight, low-volume consolidation; enter on the break of the consolidation high.
- Triangle: converging highs and lows on the 15-minute; enter on the first close outside the apex.
- VWAP reclaim: price dips below VWAP then closes back above it with volume; enter on the reclaim candle close.
- Channel breakout: price breaks the upper or lower rail of a parallel channel with a close and volume confirmation.
How do pattern-based breakouts work on intraday charts?
Pattern-based breakouts are the bread and butter of price action strategies for intraday traders. Each pattern carries a built-in measurement rule for targets, which removes guesswork from the trade.
Flags and pennants
A flag forms after a sharp directional move (the “flagpole”) when price consolidates in a tight, slightly counter-trend channel. The psychology: early buyers take partial profits, creating a brief pause before the next leg. On a 5-minute chart, a clean bull flag typically consolidates for 3–8 bars. The target is the flagpole height added to the breakout point. Flags are continuation patterns, so they perform best when the broader intraday trend is already established.
Triangles (ascending, descending, symmetrical)
Triangles form when price makes lower highs and higher lows (symmetrical), or when one side is flat (ascending or descending). On a 15-minute chart, a triangle with at least three touches on each trendline carries more conviction than one with two. The measured target is the widest part of the triangle projected from the breakout point. Ascending triangles in an uptrend are continuation setups; symmetrical triangles can break either way and require volume confirmation to trust the direction.
Channels
A channel is two parallel trendlines containing price. A breakout above the upper rail signals trend acceleration; a break below the lower rail signals a potential reversal or trend exhaustion. Channel breakouts on the 15-minute chart tend to produce the cleanest moves. The target is the channel width projected from the breakout point.
Head and shoulders
The head-and-shoulders pattern signals a reversal. The neckline is the key level: a close below it (for a topping pattern) with above-average volume confirms the break. The target is the distance from the head to the neckline, projected downward from the neckline break. On intraday charts, this pattern is most reliable on the 15-minute timeframe where the structure has enough bars to form cleanly.
Cup and handle
The cup and handle is a continuation pattern. The “cup” is a rounded consolidation; the “handle” is a tight, low-volume pullback. The breakout above the handle’s high is the entry. The target is the depth of the cup added to the breakout point. On intraday charts, this pattern typically forms on the 15-minute or 30-minute chart and suits traders with a 30–90 minute hold time.
Pro Tip: Use the three-touchpoint rule before committing to any pattern. A trendline with only two touches is a line, not a pattern. Three confirmed touches on both sides of a triangle, or three touches on a channel rail, give you a structural level the market has actually respected.
How do time-based intraday breakout setups work?
Time-based setups are anchored to specific moments in the trading session rather than to chart patterns. They are among the most consistently tradeable setups because they exploit predictable liquidity events.
Opening-range breakout (ORB)
The ORB is the most widely used intraday setup. Quantum-algo’s guide defines the standard rules: mark the high and low of the first 15 or 30 minutes after the open, go long above the high, go short below the low, and place your stop back inside the range. The target is the range height projected from the breakout point.
Step-by-step ORB checklist:
- Mark the 15-minute or 30-minute high and low at 9:45 AM or 10:00 AM ET.
- Wait for a 5-minute candle to close above the high (or below the low).
- Enter on the next candle’s open.
- Place stop at the midpoint of the range or just inside the opposite boundary.
- Set initial target at range height above the breakout point.
- Trail stop to breakeven once price reaches 1:1 R:R.
Pre-market-high breakout and gap-and-go
When a stock gaps up at the open with pre-market volume well above its average, the gap-and-go setup applies. The entry is on the first 1-minute candle close above the opening candle’s high. The stop goes below the opening candle’s low. Continuation is most reliable when the gap is driven by a specific catalyst (earnings beat, FDA approval, sector news) and significant pre-market volume. Without a catalyst, gap-and-go setups fade more often than they continue.
CurvedTrading’s beginner guide lists gap-and-go as one of five core setups and emphasizes that execution discipline matters more than pattern knowledge alone.
VWAP breakout and VWAP reclaim
VWAP (Volume Weighted Average Price) is the institutional benchmark. When price breaks above VWAP with a confirming volume bar, institutional algorithms often add to long positions, creating a self-reinforcing move. A VWAP reclaim — where price dips below VWAP and then closes back above it — is a high-probability long entry on trending days.
The VWAP breakout is most reliable in the first two hours of the session and again in the final 30 minutes. During midday (roughly 11:30 AM to 1:30 PM ET), VWAP acts more as a magnet than a launch pad, and breakouts from it tend to revert.
Time-of-day guidance
TradeAlgo’s playbook matches setups to session types: ORB and momentum breakouts for trending sessions, VWAP bounces for range-bound days. The first and last 30 minutes of the session carry the highest liquidity and volatility, making them the most fertile windows for breakout scalps and trend entries. Midday trading is where most breakouts fail — volume dries up and moves reverse quickly.
Pro Tip: If you are trading the ORB, avoid entering if the first 15-minute candle has a range wider than 2x the stock’s average daily range (ADR) divided by the number of trading hours. An abnormally wide opening candle means the range is already extended and the stop will be too large for a clean R:R.
Which indicators confirm an intraday breakout?
Confirmation indicators reduce the rate of false breakouts. The goal is not to stack every indicator you know — it is to apply a short, objective checklist before every entry.
Volume is the single most important confirmation tool. A breakout bar carrying 1.5x to 2x the average volume of the prior consolidation bars signals real order flow. Below that threshold, the move is suspect. Investopedia’s breakout guide recommends waiting for above-average volume or a confirmed close beyond the level before entering, specifically to separate real breakouts from fakeouts.
VWMA and VWAP add institutional context. The Volume Weighted Moving Average (VWMA) weights recent price action by volume, so it reacts faster to high-volume moves than a simple moving average. When the 9 EMA crosses above the 20 EMA and price is above VWAP, you have three-layer trend confirmation: short-term momentum, medium-term trend, and institutional benchmark all aligned.
RSI and MACD work best as filters, not triggers. An RSI reading above 50 (for longs) confirms momentum is on your side. A MACD histogram turning positive on the breakout bar adds weight. But never use RSI or MACD as the sole reason to enter — on fast 1-minute and 5-minute breakouts, these indicators lag by several bars and will get you in late.
Practical confirmation checklist:
- Volume on breakout bar is at least 1.5x the average of the prior 5 consolidation bars.
- Price closes above (or below) the key level on the breakout bar — not just wicks through it.
- 9 EMA is above the 20 EMA (for longs) on the entry timeframe.
- VWAP is below price (for longs) or above price (for shorts).
- RSI is above 50 (for longs) or below 50 (for shorts) — used as a filter only.
Pro Tip: To minimize indicator lag on fast breakouts, anchor your volume analysis to the breakout candle itself rather than waiting for the next bar to close. If the breakout candle’s volume is already tracking above the prior average with 30–40 seconds left in the bar, that is a real-time signal you can act on.
How do you set entries, stops, and targets for breakout trades?
Concrete rules for entry, stop, and target are what separate a trading plan from a trading idea. Mastering risk management at this level is what keeps a losing day from becoming a losing week.
Entry triggers
Three entry approaches each have a distinct tradeoff:
- Breakout close entry: enter on the close of the first bar that closes outside the level. Highest probability, but you may miss fast-moving names.
- Breakout plus retest entry: wait for price to break the level, pull back to it, and then bounce. Lower risk (tighter stop), but you miss trades that never retest.
- Momentum entry on the breakout candle: enter mid-candle when volume surges and price accelerates. Fastest execution, highest slippage risk — best suited to automated execution.
Stop placement
- Inside consolidation: stop goes just inside the consolidation boundary (below the base for longs). Tightest stop, but vulnerable to stop hunts.
- ATR-based stop: stop is placed 0.5x to 1x the 14-period ATR below the entry. Adapts to current volatility.
- Fixed tick/penny stop: used by scalpers on liquid names. Simple, but ignores volatility context.
Position sizing example: if your account is $50,000 and you risk 0.5% per trade, your max dollar risk is $250. If your stop is $0.50 away from entry, you can trade 500 shares. If your stop is $1.00 away, you trade 250 shares. The stop size drives the position size — never the other way around.
Target setting
- Measured move: project the height of the pattern (flagpole, range, triangle width) from the breakout point. This is your primary target.
- Initial R:R: aim for at least 1:2 on scalps, 1:3 on trend-capture trades.
- Trailing rules: once price reaches 1:1, move stop to breakeven. At 2:1, trail stop to 1:1. For runners, trail using the 9 EMA on the entry timeframe.
Risk management workflows that codify these rules before the trade — not during it — are what allow consistent execution under pressure.
Step-by-step entry/stop/target checklist:
- Identify the key level and confirm the tight base.
- Check volume and momentum confirmation (1.5x volume, 9 EMA above 20 EMA, price above VWAP for longs).
- Choose your entry trigger (close, retest, or momentum).
- Calculate stop distance and position size based on 0.5% account risk.
- Set initial target at measured move (1:2 minimum R:R).
- Move stop to breakeven at 1:1; trail at 2:1.
- Log the trade immediately: entry reason, stop, target, and actual outcome.
How do you recognize and avoid breakout fakeouts?
Fakeouts are the most common reason breakout traders lose money. A fakeout occurs when price briefly moves outside a key level, triggers entries, and then reverses back inside the range. Investopedia’s guidance on this is direct: waiting for a confirmed close beyond the level — not just a wick — is the single most effective fakeout filter.
Common failure modes:
- Low-volume breakout: price moves outside the level but volume is below average. No institutional participation, high reversion risk.
- Breakout against higher-timeframe structure: a 5-minute breakout to the upside when the 15-minute chart shows a clear downtrend. The higher timeframe wins most of the time.
- News-driven whipsaw: a headline hits mid-session and price spikes through a level, then reverses as the news is digested. These are not structural breakouts.
- Retest failure: price breaks a level, pulls back to retest, and then fails to hold the level. The retest failure is itself a short signal.
Concrete filters to reduce fakeouts:
- Require a full candle close outside the level, not just a wick.
- Volume on the breakout bar must be at least 1.5x the average of the prior consolidation bars.
- Check the 15-minute chart for higher-timeframe alignment before entering on the 5-minute.
- Avoid entering breakouts within 5 minutes of a scheduled news event (Fed announcements, CPI, earnings).
- Check market breadth: if the S&P 500 is reversing hard, individual stock breakouts are higher-risk.
Do-not-trade checklist:
- Volume is below average on the breakout bar.
- The breakout is against the 15-minute trend.
- A major news event is scheduled within the next 10 minutes.
- The stock has already made a 3x ADR move today (extended, low-probability continuation).
- It is between 11:30 AM and 1:30 PM ET (midday low-volume window).
Pro Tip: Use partial entries to survive inevitable fakeouts. Enter half your planned position on the initial breakout and add the second half only if price holds the level for two bars or successfully retests it. This cuts your loss in half on fakeouts while keeping you in full-size on the trades that work.
Three step-by-step intraday breakout trade examples
Example 1: Opening-range scalp (ORB)
Setup: High-ADR stock with pre-market volume above 1 million shares and a clear catalyst.
- Mark the 15-minute high and low at 9:45 AM ET.
- Wait for a 5-minute candle to close above the 15-minute high.
- Enter on the next candle’s open. Stop goes at the midpoint of the opening range.
- Target: range height added to the breakout point (1:2 minimum R:R).
- At 1:1, move stop to breakeven. At 2:1, take half off and trail the remainder with the 9 EMA.
- Exit by 10:30 AM ET if target is not reached — ORB momentum fades quickly.
Position sizing: $50,000 account, 0.5% risk = $250 max loss. If the range is $1.00 wide and stop is at the midpoint ($0.50 from entry), trade 500 shares.
Pro Tip: Journal the opening range width relative to the stock’s ADR. Over time, you will find a sweet spot — ranges that are 15–25% of ADR tend to produce the cleanest ORB moves. Wider ranges mean larger stops and lower R:R; narrower ranges often mean the stock is not moving.
Example 2: Momentum gap-and-go
Setup: Stock gaps up 8%+ at the open with a specific catalyst and pre-market volume above 500,000 shares.
- Pre-market scan: filter for gap size above 5%, pre-market volume above 500,000 shares, and a clear news catalyst.
- At the open, watch the first 1-minute candle. Do not enter until it closes.
- Enter on the close of the first 1-minute candle above the opening candle’s high.
- Stop: below the opening candle’s low.
- Target: pre-market high or a measured 1:2 R:R from entry.
- If price stalls at the pre-market high, take partial profits. Trail the remainder with the 1-minute 9 EMA.
- Exit the full position if price closes below the 9 EMA on the 1-minute chart.
Failure bailout: if the opening candle is a wide-range reversal candle (opens high, closes near the low), skip the trade entirely — the gap is fading, not continuing.
Example 3: Consolidation/pattern breakout with retest
Setup: Bull flag on the 5-minute chart after a strong opening move.
- Identify the flagpole: a sharp 3–5 bar move up with above-average volume.
- Confirm the flag: 4–8 bars of tight, low-volume consolidation with a slight downward drift.
- Entry trigger: wait for a 5-minute candle to close above the flag’s upper trendline.
- Preferred entry: if price retests the breakout level within 1–2 bars, enter on the retest bounce. Tighter stop, better R:R.
- Stop: below the flag’s lower trendline.
- Target: flagpole height added to the breakout point.
- Failure bailout: if price closes back inside the flag after the breakout, exit immediately — the pattern has failed.
Pro Tip: After each trade, log the pattern type, entry trigger used, whether it retested, and the outcome. After 30 trades, you will have real data on which entry trigger (close, retest, or momentum) performs best for your specific setup and execution style.
When should you automate your breakout strategy?
Manual execution of breakout rules is the weakest link in most traders’ workflows. The entry window on a 1-minute ORB or gap-and-go can be 10–30 seconds wide. Human reaction time, hesitation, and emotional second-guessing consistently produce late entries, oversized stops, and missed exits.
Automation addresses all three. Tickerly converts TradingView Pine Script alerts into live orders with ultra-fast execution across crypto, forex, and stock exchanges, removing the latency between signal and fill. For breakout strategies specifically, where the edge is in the first few bars after the break, execution speed is not a convenience — it is a core part of the edge.
Automation-ready rules checklist:
- Entry condition is objective: “5-minute close above the 15-minute high” — not “looks like it’s breaking out.”
- Stop is defined in ATR multiples or a fixed distance, not “wherever feels right.”
- Target is a measured move or a fixed R:R multiple.
- Volume condition is quantified: “breakout bar volume > 1.5x the 5-bar average.”
- Timeframe is anchored: the rule fires only on the specified chart timeframe.
Automation workflow: Backtest your rules on at least 60 historical setups to confirm positive expectancy. Run paper trading for two weeks to validate alert fidelity and execution timing. Move to small live size (10–25% of intended position) for two weeks. Scale to full size only after confirming live performance matches backtest expectations. Monitor alert logs daily and set hard daily loss limits to prevent runaway exposure.
Algorithmic trading trends in 2026 point toward multi-symbol, multi-strategy automation as the standard for serious day traders. Running three breakout strategies simultaneously across different symbols — ORB on one, gap-and-go on another, VWAP reclaim on a third — is only practical with automation.
Pro Tip: Build a kill switch into every automated breakout strategy: a maximum daily loss threshold that halts all new orders for the session. Set it at 2x your average winning day. This single guardrail prevents the scenario where a bad news day or a data feed error turns a manageable drawdown into an account-damaging loss.
An honest take on how breakout trading actually works
The conventional wisdom says breakout trading is simple: wait for the level, confirm with volume, enter, and manage the trade. That framing is accurate but dangerously incomplete.
The part most articles skip is this: the majority of intraday breakout attempts fail. The edge in breakout trading does not come from a high win rate — it comes from keeping losses small on the failures and letting the winners run. A trader who wins 40% of their breakout trades but maintains a consistent 1:2.5 R:R is profitable. A trader who wins 60% but takes 1:1 trades and lets losers run is not.
The setups I return to most consistently are the 15-minute ORB on high-ADR names and the bull flag continuation on the 5-minute chart. Both have objective entry rules, measurable targets, and clear failure conditions. Before I take either setup, I check three things: is the broader market trending or range-bound, is the stock’s relative volume above 1.5x, and is the pattern clean enough that I could describe the entry rule in one sentence? If I cannot state the entry rule in one sentence, the setup is not ready.
Journaling is not optional at this level. Every trade gets logged with the pattern type, entry trigger, stop distance, target, and actual outcome. After 50 trades in a setup, the data tells you whether you have an edge or a bias. Most traders discover their edge is narrower than they thought — and that is useful information, not discouraging news.
Tickerly turns your breakout rules into live automated trades
Breakout trading rewards speed and consistency above almost everything else. The entry window is narrow, the stop is tight, and the decision has to be made in seconds. Manual execution introduces hesitation, emotional override, and late fills — all of which erode the edge that the setup itself provides.

Tickerly converts your TradingView breakout alerts into fully automated live orders across crypto, forex, and stock exchanges, with execution speed that closes the gap between signal and fill. You define the objective rules — entry condition, stop distance, target level, volume filter — and Tickerly executes them without deviation, across multiple symbols simultaneously. No second-guessing, no missed entries, no emotional exits.
Start automating your breakout strategies with Tickerly and run your first strategy on a 30-day free trial. Your rules, your edge, executed precisely every time.
Sources
The following sources were used for rules, setup examples, and confirmation guidance throughout this article:
- Day Trading Breakouts: 4 Strategies Updated April 2026
- Breakout Trading Strategy: A Guide for Traders | IG International
- Trading breakouts – Investopedia
- Breakout Trading Strategy: How to Catch Real Breakouts and Avoid Fakeouts
- Day Trading Strategies 2026 — The Complete Profitable Guide
- Day Trading Strategies for Beginners: 5 Setups (2026)
- Day Trading Strategies: 7 Proven Setups Used by | TradeAlgo
- Finance
This article is general information, not a substitute for advice from a qualified financial advisor. Consult a qualified financial professional about your own circumstances before acting on anything here.
FAQ
What are the different types of breakout trading?
The main day trading breakout types are opening-range breakouts (ORB), gap-and-go, pattern-based breakouts (flags, triangles, channels, head and shoulders, cup and handle), channel breakouts, and VWAP breakouts. Each is categorized as either a continuation or reversal setup and requires volume confirmation to distinguish real breaks from fakeouts.
What is the 3-5-7 rule in day trading?
The 3-5-7 rule is a risk management guideline: risk no more than 3% of your account on any single trade, keep total open risk below 5% across all positions, and target a minimum 7% gain on winning trades to maintain positive expectancy. It is a framework for position sizing and R:R discipline, not a pattern-recognition rule.
Is it true that 97% of day traders lose money?
Studies on retail day trader performance consistently show that the majority of day traders lose money over time due to poor risk management, overtrading, and taking breakout trades without volume confirmation rather than any inherent flaw in the strategies themselves. The primary causes are poor risk management, overtrading, and taking breakout trades without volume confirmation rather than any inherent flaw in the strategies themselves.
Can you make $1,000 a day with day trading?
A daily profit target is achievable but requires a sufficiently large account and a consistent edge. CurvedTrading’s guide emphasizes that execution discipline and risk management determine profitability far more than the specific setup used.
How do you avoid fakeouts in breakout trading?
Require a full candle close outside the key level (not just a wick), confirm that breakout bar volume is at least 1.5x the average of the prior consolidation bars, and check that the breakout aligns with the higher-timeframe trend. Avoiding entries within 5 minutes of scheduled news events also significantly reduces whipsaw risk.