

Trading bots detect volatility through a layered stack of microstructure signals and statistical regime indicators, then apply proportional responses ranging from position-size scaling to full shutdown, depending on how severe and persistent the shock is. The most broadly effective control combination is volatility-targeted sizing paired with an early regime detector, because it keeps risk exposure proportional to current conditions without requiring a human to intervene on every spike. Understanding bot market volatility responses at this level of specificity is what separates a bot that survives a flash event from one that blows up in it.
The three fastest-acting automated responses when volatility spikes are:
-
Automated order cancellation and quote withdrawal — removes open resting orders within milliseconds to prevent adverse fills during a liquidity vacuum
-
Volatility-based position-size scaling — reduces trade size in real time as realized volatility rises, keeping dollar risk roughly constant
-
Circuit breaker / hard kill switch — halts all new order submission when a predefined drawdown or vol threshold is breached
Key Takeaways
Volatility-targeted position sizing combined with an early regime detector is the most broadly tested and reliable foundation for bot market volatility responses across asset classes.
| Point | Details |
|---|---|
| Layer your detection signals | Microstructure signals (spread, depth) catch immediate stress; statistical measures (realized vol z-score, GARCH persistence near unity in crypto) confirm regime shifts. |
| Size to vol, not to conviction | Use size = (target_vol / current_vol) × base_size and recalculate on every alert to keep dollar risk constant across regimes. |
| Backtest by regime, not full history | Segment backtests into low-, medium-, and high-vol periods; use regime-dependent fill models and synthetic jump scenarios to stress-test responses realistically. |
| Kill switches are non-optional | Define soft and hard intraday drawdown limits, a heartbeat monitor, and a data-quality circuit-breaker before any live deployment. |
| Tickerly automates the execution layer | Tickerly converts TradingView Pine Script alerts into live bot orders with configurable per-bot caps and alert telemetry, enabling the full volatility-response checklist without custom server code. |
Table of Contents
-
What bots actually do when volatility spikes: responses and tradeoffs
-
How to backtest and stress-test your bot’s volatility responses
-
ML and online-learning approaches for adapting to volatility
-
Historical examples where bots amplified volatility and what to learn from them
-
Your volatility-resilience checklist: what to configure before going live
-
Tickerly turns your TradingView strategy into a volatility-aware live bot
What bots actually do when volatility spikes: responses and tradeoffs
The range of automated responses to elevated volatility is wider than most traders configure. Each response has a natural trigger, a specific execution mechanic, and a real cost. Knowing the tradeoffs is what lets you combine them intelligently rather than defaulting to a full shutdown every time the VIX ticks up.
-
Volatility-targeted position sizing. The formula is straightforward:
size = (target_vol / current_vol) × base_size. When realized vol doubles, size halves. This keeps dollar risk roughly constant across regimes. The downside is that it reduces size precisely when breakout moves are largest, so trend-following bots may give up significant upside during the early phase of a genuine trend. -
Order cancellation and quote withdrawal. Triggered when spread exceeds a multiple of its rolling average or when book depth drops below a minimum threshold. Execution is immediate: all resting limit orders are canceled via a bulk cancel API call. The risk is that a cancel-and-repost cycle during a fast market can result in partial fills at worse prices than the original order.
-
Spread widening (for market-making bots). A market-making bot responds to elevated vol by posting quotes further from mid-price, compensating for the higher adverse-selection risk. The tradeoff is reduced fill rate and lower revenue per unit time, but the alternative is being picked off repeatedly by informed flow.
-
Passive and execution-minimizing order types. Under elevated volatility, switching from aggressive market orders to passive limit orders, iceberg orders, or VWAP/TWAP execution algorithms reduces market impact and slippage. Algorithmic execution strategies like TWAP break a large order into time-sliced child orders, reducing the footprint during a volatile period. The cost is timing risk: the market may move further against you while you are filling slowly.
-
Hedging with options or correlated instruments. A bot can open a delta hedge using options (buying puts on a long equity position, for example) or trade a correlated instrument in the opposite direction. This reduces net exposure without closing the primary position. The main cost is the hedge premium and the basis risk if the correlation breaks down during the stress event.
-
Strategy mode switching. Some bots carry multiple strategy modes (trend-following, mean-reversion, flat/neutral) and switch between them based on regime signals. A breakout bot might switch to a mean-reversion mode when vol is high and price is oscillating, or go flat entirely. This requires pre-tested mode transitions and clear regime boundaries to avoid thrashing between modes.
-
Hard shutdown. The last resort: all positions are closed or hedged, no new orders are submitted, and the bot waits for conditions to normalize. Appropriate when multiple risk limits are breached simultaneously or when data quality degrades (stale prices, feed outages). The cost is missed recovery moves and the transaction cost of closing positions into a wide market.
Combining responses is usually more effective than relying on a single one. When it crosses 2.5, cancel all resting orders and widen spreads. When it crosses 3.5 or intraday drawdown hits the soft limit, trigger a full shutdown. This graduated escalation avoids the binary choice between “run normally” and “shut everything down.”
Production risk controls every bot needs before going live
No automated strategy should run in production without a defined set of safeguards that operate independently of the strategy logic itself. These controls are not optional enhancements. The 2010 Flash Crash, which saw the Dow Jones Industrial Average drop nearly 1,000 points in minutes, is the canonical example of what happens when circuit-breakers are absent or misconfigured at scale. SEC and CFTC post-event analysis identified liquidity withdrawal by algorithmic traders as a primary amplifying mechanism, and the resulting regulatory guidance made firm-level circuit-breakers a de facto requirement for any serious automated trading operation.
Standard position and exposure safeguards:
-
Per-order size caps: a hard maximum on any single order, expressed in shares, contracts, or notional value
-
Per-symbol exposure limits: maximum net position in any single instrument at any time
-
Portfolio-level gross and net exposure limits: aggregate notional caps across all open positions
-
Intraday drawdown soft limit: triggers a size reduction or mode switch when daily P&L drops to a warning threshold
-
Intraday drawdown hard limit: triggers a full shutdown when daily P&L drops to the maximum acceptable loss
Kill switches and escalation paths:
-
Automated circuit-breaker: fires when any hard limit is breached, cancels all orders, and blocks new submissions
-
Heartbeat monitor: if the bot fails to send a status ping within a defined interval (typically 5–30 seconds), an external watchdog process cancels all open orders and alerts the operator
-
Data-quality circuit-breaker: halts order submission when price feeds are stale, bid-ask spread exceeds a maximum multiple, or L2 depth falls below a minimum threshold
-
Human-in-loop escalation: for large exposures or novel market conditions, the bot sends an alert and waits for manual confirmation before resuming
Monitoring telemetry to watch in real time:
-
Latency (order submission to exchange acknowledgment): a sudden increase signals network or exchange-side issues
-
Order-to-fill time: rising fill times indicate liquidity stress or queue depth problems
-
Realized slippage vs. modeled slippage: when realized slippage consistently exceeds the backtest model, the fill model needs recalibration
-
Quote-refresh rate on your own quotes: abnormally fast cycling can indicate a feedback loop with other bots
-
Max adverse excursion (MAE) per trade: tracks how far a position moves against you before closing; a rising MAE trend signals deteriorating entry quality
A practical risk management workflow treats these telemetry metrics as leading indicators, not lagging ones. When latency spikes or slippage widens before a drawdown limit is hit, that is the signal to reduce size or pause, not wait for the hard limit to fire.
Statistic callout: The SEC/CFTC joint report on the 2010 Flash Crash documented that automated liquidity providers withdrew quotes within minutes of the initial stress, removing approximately $26 billion in buy-side depth from the E-mini S&P 500 futures market. Circuit-breakers and coordinated pause mechanisms were subsequently mandated across U.S. equity and futures exchanges as a direct result.
How to backtest and stress-test your bot’s volatility responses
A backtest that does not segment by volatility regime will give you a misleading picture of how your bot actually performs when conditions get difficult. Most strategies look fine on a full-history backtest because calm periods dominate the data.
Key test types to run:
-
Historical replay segmented by volatility regime — split your backtest data into low-vol, medium-vol, and high-vol periods using realized-vol z-scores or VIX percentile bands. Run the strategy separately on each segment and compare drawdown, hit rate, and Sharpe ratio across regimes.
-
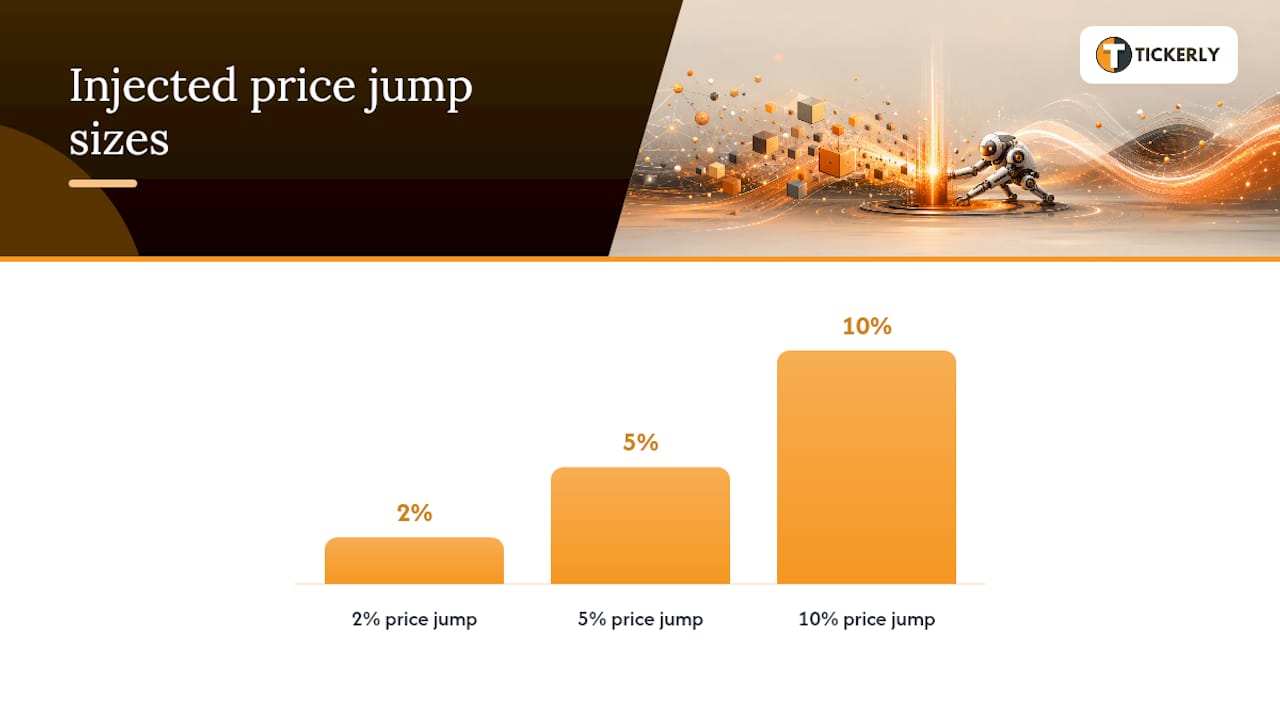
Synthetic jump scenarios — inject artificial price jumps of 2%, 5%, and 10% into your historical data at random intervals to test how the bot responds to sudden shocks that may not appear in your specific historical window.
-
Monte Carlo with fat tails — generate synthetic price paths using a Student’s t-distribution (degrees of freedom 3–5) rather than a normal distribution, to simulate the heavy-tailed return distributions that characterize real markets during stress.
-
Spread-tax modeling — simulate widened bid-ask spreads (2x, 5x, 10x normal) and partial fill rates during high-vol periods. Backtests that ignore realistic fills and slippage overstate performance, particularly in volatile markets where the difference between mid-quote and actual fill price can be substantial.
-
Overlay toggle testing — run the same strategy with and without the volatility-targeting overlay to quantify exactly how much drawdown reduction the overlay provides and at what cost to returns.
Metrics to report from every stress test:
-
Max drawdown and time-to-recovery — the depth and duration of the worst equity decline
-
Realized vs. modeled slippage — how much worse actual fills are compared to your fill model
-
Max adverse excursion (MAE) — the worst intra-trade move against you before the trade closed
-
Hit rate during stress periods — does your win rate hold up when vol is elevated, or does it collapse?
-
Liquidity shortfall frequency — how often does the bot attempt to fill a size that exceeds available depth?
On fill modeling: use regime-dependent fill models rather than a single constant slippage assumption. In calm markets, a 0.5 basis-point slippage estimate may be reasonable. During a high-vol period, 5–15 basis points is more realistic for liquid instruments, and multiples of that for less liquid ones. Platforms like QuantConnect provide fee-, slippage-, and spread-adjusted backtesting engines that make regime-dependent fill modeling practical without building it from scratch.
For long-term strategy robustness, the goal of stress testing is not to find a parameter set that survives every historical scenario. It is to understand the conditions under which your bot fails, so you can set appropriate kill-switch thresholds and position limits before those conditions arrive.
ML and online-learning approaches for adapting to volatility
Machine learning can genuinely improve a bot’s volatility responses, but the failure modes are severe enough that most production systems keep ML in a supporting role rather than giving it direct control over order submission.
The most practical ML approaches for volatility adaptation are:
-
Online variance estimators (EWMA/GARCH updates) — update volatility estimates tick-by-tick without refitting a full model; computationally cheap and interpretable
-
Markov regime-switching detectors — model the market as switching between a small number of hidden states (low-vol, high-vol, crisis); the posterior probability of each state drives parameter selection
-
Bandit / Thompson-sampling for parameter exploration — treat parameter choices (e.g., which vol threshold to use) as arms in a multi-armed bandit; allocate more capital to the parameter set that has performed best recently while maintaining exploration
-
Decay-balancing heuristics — a principled approach to pricing and sizing under uncertain arrival rates; research on market response under uncertainty shows that decay balancing is computationally efficient and offers provable performance bounds under specific prior assumptions, making it a credible alternative to purely greedy heuristics
When many bots act on similar ML-derived signals, their coordinated actions can amplify volatility even when each bot is individually rational. Proportional response dynamics research shows that distributed update rules can converge toward equilibrium in some market models, but the convergence path can itself generate systemic patterns. This is the mechanism behind several flash events: individually sensible algorithms producing collectively destabilizing behavior.
Known pitfalls:
-
Nonstationarity — market regimes shift; a model trained on 2022 crypto volatility may not generalize to 2025 conditions
-
Delayed labels — fill confirmations arrive after the action, creating a lag between what the model decided and what it learns from
-
Reward sparsity — in low-frequency strategies, there are too few trades per day to update a model meaningfully
-
Adversarial regimes — some volatility spikes are caused by other adaptive algorithms; your model may be learning a pattern that disappears as soon as enough bots learn the same thing
Pro Tip: Keep a simple rule-based backbone (volatility z-score thresholds, hard position caps) that the ML layer cannot override. Expose only a small number of ML-tuned parameters, such as the vol-scaling multiplier or the regime-switch sensitivity. Before enabling any ML-tuned parameter in live trading, run it in shadow mode alongside the rule-based system for at least 30 days and require a statistically meaningful improvement in risk-adjusted returns before switching.
Historical examples where bots amplified volatility and what to learn from them
Real-world events provide the clearest evidence for why bot market volatility responses need to be designed with systemic awareness, not just individual strategy optimization.
The 2010 Flash Crash (May 6, 2010)
A large sell program in E-mini S&P 500 futures triggered a cascade of automated responses across equity and futures markets. As prices fell, algorithmic market makers withdrew liquidity, order-book depth collapsed, and automated stop-loss orders accelerated the decline. Within 36 minutes, the Dow Jones Industrial Average had fallen nearly 1,000 points before recovering almost entirely. The SEC/CFTC joint investigation identified the interaction between a large algorithmic sell order and the liquidity-withdrawal behavior of high-frequency traders as the primary mechanism. The lesson for bot designers: your bot’s cancel logic does not operate in isolation. When every market-making bot cancels simultaneously, the result is a liquidity vacuum that amplifies the very volatility that triggered the cancels.
Earnings-driven flash moves
Bots that hold positions through earnings without a defined vol-scaling rule or a hard exposure cap are exposed to these moves with no warning. The microstructure signal that often precedes these moves is a sharp widening of the bid-ask spread and a drop in order-book depth in the minutes before the announcement, as informed traders position and market makers reduce their exposure.
Crypto order-book vacuums
The mechanism is straightforward: a large forced liquidation hits a thin book, price drops to the next cluster of bids, which triggers more liquidations, and the cycle repeats. Bots that do not monitor order-book depth as a primary signal are effectively blind to the preconditions for these events.
Lessons to apply directly to bot design:
-
Monitor bid-ask spread and order-book depth as primary microstructure signals, not secondary ones
-
Design cancel logic to be graduated, not binary: reduce size before withdrawing entirely
-
Set position limits that account for the possibility that your exit will move the market against you
-
Asynchronous distributed update dynamics show that many independent bots acting on similar signals can produce convergent, system-level patterns — design your bot to behave differently from the crowd during stress, not identically to it
Your volatility-resilience checklist: what to configure before going live
This checklist applies to any automated strategy running in U.S. markets. Work through it in order: sizing and kill switches first, execution adjustments second, ML components last.
-
Set your regime detector thresholds. Compute a realized-vol z-score using a 20-day rolling mean and standard deviation. Define three zones: normal (z < 1.5), elevated (1.5 ≤ z < 2.5), and crisis (z ≥ 2.5). Assign a sizing multiplier to each zone (1.0x, 0.5x, 0.25x as conservative defaults).
-
Implement volatility-targeted position sizing. Use the formula
size = (target_vol / current_vol) × base_size, where target_vol is your desired annualized volatility contribution per trade. Recalculate on every bar or every alert, not just at session open. -
Define per-order and portfolio caps. Set a hard maximum order size (no single order exceeds X% of average daily volume for that instrument). Set a gross portfolio exposure cap (total notional across all open positions). These caps must be enforced at the order-generation layer, not just in the strategy logic.
-
Configure spread-widening rules. For market-making or quote-driven strategies, define the spread multiplier as a function of realized vol: at 2x normal vol, widen quotes by 1.5x; at 3x normal vol, widen by 2.5x. For directional strategies, define a maximum spread threshold above which you will not enter new positions.
-
Set hedging triggers. If your strategy carries overnight or multi-day positions, define the vol threshold at which you add a delta hedge (e.g., buy puts when VIX crosses 25, or when realized vol z-score exceeds 2.0). Pre-define the hedge instrument and sizing formula so the bot can execute without human input.
-
Define kill-switch rules. Hard intraday drawdown limit: if daily P&L drops below X%, cancel all orders and halt new submissions for the remainder of the session. Soft limit: at 60% of the hard limit, reduce size to 25% of normal. Heartbeat monitor: if no status ping within 30 seconds, external watchdog cancels all orders.
-
Build your monitoring dashboard. Track latency, order-to-fill time, realized slippage vs. modeled slippage, MAE per trade, and order-book depth for each traded instrument. Set alerts for any metric that exceeds 2x its rolling average.
-
Run shadow-mode A/B tests before enabling ML knobs. Any ML-tuned parameter (vol-scaling multiplier, regime-switch sensitivity) runs in shadow mode alongside the rule-based system for a minimum of 30 days. Require a meaningful improvement in Sharpe ratio and max drawdown before switching to live.
-
Schedule retraining cadence for adaptive models. Retrain or recalibrate ML components on a fixed schedule (weekly or monthly), not on-demand. Ad-hoc retraining in response to a bad week is a form of overfitting.
-
Document and test your escalation path. Define who gets alerted when a hard limit fires, what the manual override procedure is, and how long the bot stays halted before it can resume. Run a quarterly drill where you simulate a hard-limit event and verify the escalation path works end-to-end.
For U.S.
How Tickerly operationalizes volatility-response controls
Tickerly converts TradingView Pine Script alerts into live trading bots across crypto, forex, stocks, and futures, with the execution infrastructure needed to implement the checklist above without custom server code. The platform’s architecture maps directly to the control layers described throughout this article.
Key capabilities relevant to volatility resilience:
-
Alert-driven automation from TradingView — your Pine Script strategy fires an alert when a regime signal or entry condition is met; Tickerly receives the alert via webhook and submits the order to the connected exchange API within milliseconds, keeping latency between signal and execution minimal
-
Configurable position sizing and vol-scaling overlays — position size can be defined per alert, allowing your Pine Script to pass a dynamically calculated size based on current realized vol, so the
size = (target_vol / current_vol) × base_sizeformula runs inside your strategy and the output is passed directly to Tickerly for execution -
Per-strategy caps and exposure controls — each bot instance can be configured with maximum position sizes and order limits, providing a production-level cap that operates independently of the strategy logic
-
Multi-strategy, multi-asset deployment — run your normal-vol strategy and your high-vol fallback strategy as separate bots simultaneously; when your regime detector fires in Pine Script, it can send alerts to different bots, effectively implementing strategy mode switching without additional infrastructure
-
Support for MetaTrader 4/5 alongside exchange APIs — for forex traders who need MT4/MT5 execution alongside crypto or stock bots, Tickerly handles both within a single platform
Implementation flow:
-
Define your regime detector in Pine Script (vol z-score, ATR multiple, or VIX threshold)
-
Configure alert messages to include dynamic position size and strategy mode
-
Connect Tickerly to your exchange via API and set per-bot order caps
-
Run in paper trading or with minimal size for 2–4 weeks to validate alert delivery and fill quality
-
Enable full live deployment once telemetry confirms latency and slippage are within modeled bounds
Speed versus safety: where the real tradeoff lives
The conventional framing of automation speed versus human oversight misses the actual decision point. Speed is not the variable you are trading off against safety. The real tradeoff is between the granularity of your pre-defined rules and the frequency of conditions those rules were not designed for.
For small exposures and well-tested strategies, fast automated execution is almost always the right choice. A human cannot cancel 50 resting orders in 200 milliseconds. A bot can. The cases where human oversight genuinely adds value are not the fast ones. They are the novel ones: a regime that has no historical analog, a correlation breakdown between your hedge and your primary position, or a data feed anomaly that your circuit-breakers did not anticipate.
The organizational practices that matter most are not the ones that slow the bot down. They are the ones that improve the quality of the rules the bot runs. Incident drills, where you simulate a hard-limit event and walk through the escalation path, reveal gaps in your kill-switch logic before a real event does. Post-mortems after any significant drawdown or unexpected behavior should focus on which rule failed or was missing, not on blaming the market. Constrained automation, where the bot has authority over a defined set of actions and humans retain authority over everything outside that set, is more durable than either full automation or full manual control.
The algorithmic trading trends that matter for 2026 are not about faster execution or more sophisticated ML. They are about better-defined boundaries: knowing exactly what your bot is authorized to do, under what conditions, and what happens when those conditions are not met.
Tickerly turns your TradingView strategy into a volatility-aware live bot
Every control described in this article, from vol-targeted sizing to kill switches to regime-based mode switching, requires a reliable execution layer between your signal and the market. Tickerly provides that layer for TradingView traders without requiring server infrastructure or custom API code.

Your Pine Script strategy already contains the logic. Tickerly connects it to live exchanges with millisecond execution, per-bot position caps, and full alert telemetry so you can monitor slippage and latency in real time. Whether you are running a single crypto strategy or multiple automated strategies across forex, stocks, and futures simultaneously, the platform handles execution while you focus on strategy design and risk rules.
The 30-day free trial gives you enough time to run shadow-mode validation, confirm your alert delivery is reliable, and verify that your vol-scaling logic is passing the right sizes to the exchange before committing real capital. Start your trial at Tickerly’s strategy automation platform and connect your first TradingView bot today.
Sources
These are the primary sources used in this article. Each is worth reading directly if you are designing or auditing a production bot’s volatility-response framework.
Use these sources when designing your backtesting regime segmentation, calibrating your GARCH persistence thresholds, and building the policy documentation your risk controls require.
This article is general information, not a substitute for advice from a qualified financial advisor. Consult a qualified financial professional about your own circumstances before acting on anything here.
FAQ
What signals do trading bots use to detect market volatility?
Bots use two layers: microstructure signals (bid-ask spread, order-book depth, quote-refresh rate) for immediate liquidity stress, and statistical measures (realized-vol z-scores, ATR, GARCH persistence, VIX) for regime-level shifts that persist over hours or days.
Is bot trading actually profitable in volatile markets?
It depends entirely on whether the bot’s volatility-response rules were designed and backtested for elevated-vol regimes. Bots with volatility-targeted sizing and regime-segmented backtests tend to preserve capital during stress; bots sized for calm markets without adaptive controls often suffer outsized drawdowns during spikes.
What is the 3-5-7 rule in the stock market?
It is a simple heuristic for manual traders; automated strategies typically implement more dynamic vol-targeted sizing formulas instead.
How can you tell when a bot is responding to a market move?
Signs of automated bot responses include sudden order-book depth collapse, a sharp widening of bid-ask spreads within milliseconds, and price moves that reverse almost as quickly as they started. These microstructure patterns are characteristic of mass cancel-and-repost cycles by algorithmic market makers reacting to a volatility signal.
How does Tickerly help manage bot behavior during volatility?
Tickerly lets you pass dynamic position sizes directly from your TradingView Pine Script alerts, so your vol-scaling formula runs inside the strategy and the output is executed immediately via exchange API. Per-bot order caps and alert telemetry give you an independent safety layer and real-time visibility into execution quality during volatile periods. Learn more at Tickerly’s automated trading FAQ.