

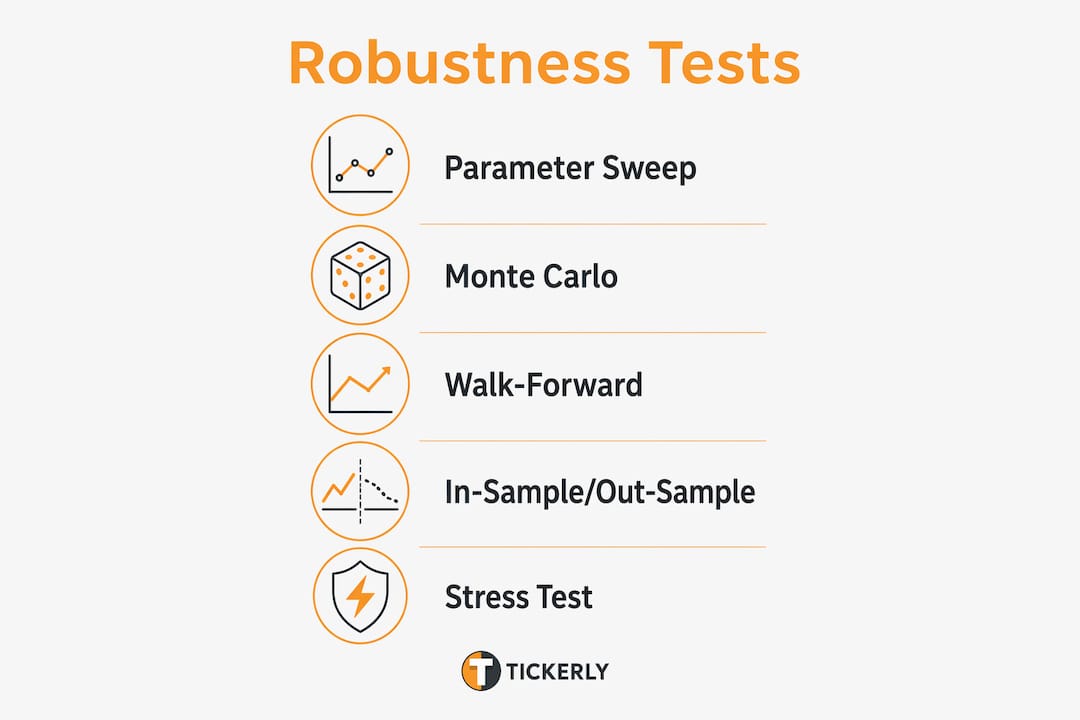
A strategy is deployable only after it passes a minimum set of independent robustness checks — not just a clean backtest. Run these tests now, in this order, before committing a single dollar of live capital:
- In-sample / out-of-sample (IS/OOS) split — reserve a significant portion of your data as a locked, untouched OOS period
- Walk-forward analysis — roll the IS/OOS window forward in anchored or rolling steps; build a walk-forward matrix
- Parameter sensitivity sweep — test a ±25% neighborhood around every optimized parameter
- Monte Carlo (trade resample + sequence randomization) — run many iterations of each variant
- Noise/perturbation testing — inject bar-level price noise and signal degradation
- Slippage, commission, and latency stress — double your assumed costs and re-run
- Cross-market and cross-timeframe validation — confirm the edge holds on at least two additional symbols or timeframes
- Missing-trade simulation — randomly skip a portion of signals and measure performance degradation
The cheapest place to start is a spreadsheet-based parameter sweep and a Monte Carlo workbook. Log every test run with its code version, data snapshot, parameter grid, and random seed before you touch the next test.
Pro Tip: Set up a single experiment log file on day one. Record the test name, date, seed, parameters, and key metrics for every run. Without this, you cannot prove your OOS period was truly untouched.

Table of Contents
- What “strategy robustness” actually means for algo traders
- Why skipping robustness checks destroys capital faster than bad entries
- The core robustness tests: what each one detects and how to act on failure
- How to run tests reproducibly: data, workflow, and compute
- How to read test outputs and set objective deployment criteria
- When robustness tests mislead and what “breaking points” actually tell you
- Key Takeaways
- What I’d prioritize if I were starting a robustness review today
- Tickerly turns validated strategies into live bots without the manual overhead
- Recommended reading and tools for implementing robustness tests
- FAQ
What “strategy robustness” actually means for algo traders
In algorithmic trading, robustness means the stability of a trading edge under realistic deviations from the assumptions baked into your model. A strategy is robust if its core performance metrics — Sharpe ratio, maximum drawdown, win rate — degrade gradually rather than collapse when you perturb inputs, change markets, or stress execution conditions.
Robustness testing is distinct from the other stages of strategy development:
- Development phase: You build and optimize the strategy on in-sample data.
- Validation phase: You run a first OOS check and lock in parameters.
- Robustness stress tests: You deliberately break the strategy by changing assumptions — costs, data, parameters, market conditions.
- Forward/paper testing: You run the locked strategy on live, unseen data before committing capital.
Three diagnostics show up repeatedly in professional quant workflows: the Deflated Sharpe Ratio (DSR), which adjusts for multiple testing and non-normality; walk-forward analysis, which tests generalization across rolling time windows; and Monte Carlo simulation, which quantifies the distribution of possible outcomes. None of these is a guarantee of future returns. They are evidence of a disciplined process, not proof that the edge will persist.
Why skipping robustness checks destroys capital faster than bad entries
The failure modes that robustness testing catches are not theoretical. They are the specific reasons most algo strategies underperform in live trading.
- Look-ahead leakage: A strategy that accidentally uses future data in its signal will backtest brilliantly and fail immediately in production.
- Overfitting / curve-fitting: Parameters tuned to a single historical period produce a backtest that fits noise, not signal. The strategy collapses on the first regime it has not seen.
- Fragility to execution costs: A strategy with a 0.8 Sharpe at zero cost may go negative when realistic slippage and commissions are applied. Doubling assumed slippage is a minimum stress test.
- Liquidity mismatch: A strategy sized for $50,000 that was backtested on daily closes may face significant market impact at the bar level in live trading.
The operational payoff of knowing your strategy’s breaking points is concrete: you can set position-sizing limits calibrated to the conditions that cause failure, write explicit monitoring rules that trigger a rollback, and allocate capital across strategies with genuinely uncorrelated failure modes. A strategy that collapses when slippage doubles tells you the maximum position size at which execution costs remain tolerable — that is directly actionable for risk management.
The core robustness tests: what each one detects and how to act on failure
Professional robustness testing challenges a strategy across multiple independent dimensions. The table below maps each test to its purpose, implementation cost, expected output, and the remediation step when it fails.
| Test | What it detects | Implementation difficulty | Typical output / metrics | How to act on failure |
|---|---|---|---|---|
| IS/OOS split | Basic generalization; look-ahead leakage | Low (data split) | OOS Sharpe, drawdown vs. IS | Reduce parameter count; check for leakage |
| Walk-forward analysis | Regime sensitivity; parameter stability over time | Medium (rolling windows) | Walk-forward matrix; % profitable windows | Widen parameter ranges; reduce optimization depth |
| Parameter sensitivity sweep | Overfitting; narrow spike vs. stable plateau | Low–Medium (grid search) | Histogram of metric vs. parameter; baseline percentile | Shift to plateau region; simplify model |
| Monte Carlo (resample) | Lucky-trade concentration; single-trade risk | Medium (scripted loops) | Distribution of Sharpe/drawdown; 5th–95th percentile band | Reduce per-trade position size |
| Monte Carlo (sequence randomization) | Sequence dependence; streak fragility | Medium | Drawdown distribution across permutations | Add drawdown-based position scaling |
| Noise/perturbation testing | Signal fragility; bar-level precision dependence | Medium | Performance vs. noise level curve | Relax entry/exit precision; use limit orders |
| Shifted-time / data-shift test | Entry/exit timing sensitivity | Low–Medium | Metric change vs. bar shift | Widen entry windows; reduce time-sensitivity |
| Cross-symbol / cross-timeframe | Edge specificity; data-mining bias | Medium | Consistency of Sharpe sign across markets | Treat as market-specific; reduce position size |
| Vs. random / null hypothesis | Whether edge exceeds chance | Medium (permutation test) | p-value or percentile vs. random strategies | Discard or redesign strategy logic |
| Missing-trade simulation | Execution reliability dependence | Low | Performance at 10%, 20%, 30% skip rates | Add execution buffer; reduce frequency |
| Slippage / commission / latency stress | Cost sensitivity; execution fragility | Low | Break-even cost level | Increase minimum edge per trade |
| Stress scenario (crash / regime) | Tail-risk behavior; regime-change fragility | Medium–High | Max drawdown in stress scenario windows | Add volatility filter; reduce size in high-VIX regimes |
| k-fold cross-validation | Generalization across non-contiguous periods | Medium | Variance of metric across folds | Simplify model; increase data length |
Parameter sensitivity: plateau vs. spike. When you plot a histogram of your performance metric across the parameter neighborhood, you want a wide, flat plateau centered near your chosen value. A narrow spike — where performance is exceptional at exactly one parameter value and drops sharply on either side — is a strong overfitting signal. Compute the baseline’s percentile rank within the distribution: if your chosen parameter sits above the 90th percentile of all tested values, treat that as a red flag, not a green light.
Pro Tip: Run your parameter sweep first, before Monte Carlo. If the strategy fails the sweep, Monte Carlo results are meaningless — you are stress-testing an already-overfit model.
Statistic callout: When your baseline result sits at or above the 95th percentile of a Monte Carlo or parameter-sweep distribution, that is not a sign of a great strategy. It is a sign that the strategy was tuned to that specific data sample. A well-generalized strategy typically lands in the 50th–75th percentile of its own stress-test distribution.
How to run tests reproducibly: data, workflow, and compute
A reproducible testing workflow has six stages, and skipping any one of them introduces the leakage or selection bias that invalidates your results.
- Development: Build and optimize on in-sample data only. Count every parameter trial — this count feeds your DSR calculation later.
- Validation: Run a first OOS check. Freeze all parameters immediately. Never re-optimize after seeing validation results.
- Robustness stress tests: Run the full battery from the table above on the locked strategy. Log every run.
- Paper / forward test: Deploy the locked strategy in a paper-trading environment for at least 30–60 trading days, capturing realistic fills.
- Phased live rollout: Start at 10–25% of target size. Scale up only after live metrics match paper-test expectations.
- Ongoing monitoring: Track Sharpe, max drawdown, trade density, and DSR diagnostics in production; set explicit rollback triggers.
Data checklist before you run a single test:
- Use point-in-time data to avoid look-ahead bias in fundamental or index-composition data
- Confirm your universe is survivorship-free (includes delisted symbols)
- Handle timezone normalization and futures contract rolls explicitly
- Version your data snapshot so every test run references the same underlying dataset
- For intraday strategies, use tick or minute-bar data; daily bars miss intraday execution realities
Compute estimates: A single-symbol daily parameter sweep across a 20-year history typically runs in minutes on a modern laptop. A multi-symbol intraday Monte Carlo with 1,000 iterations can take 30 minutes to several hours depending on bar count and script efficiency. Tools like Build Alpha and StrategyQuant include built-in Monte Carlo and walk-forward engines that parallelize these runs significantly.
Pseudocode outline for Monte Carlo resampling:
load backtest_trades from CSV
for i in 1 to 1000:
    resampled = random_sample_with_replacement(backtest_trades)
    metrics[i] = compute_sharpe_drawdown(resampled)
plot histogram(metrics)
mark baseline percentile on histogram
export results to analysis_workbook
Store outputs in CSV files organized by strategy ID, test type, date, and seed. A workbook-based workflow with INPUT tabs feeding analysis tabs that produce percentile histograms makes pass/fail decisions transparent and auditable.
Pro Tip: Use a reproducible random seed for every Monte Carlo run and record it in your experiment log. Without a fixed seed, you cannot reproduce a result six months later when you need to defend a deployment decision.

How to read test outputs and set objective deployment criteria
Clear decision rules prevent the most common mistake in robustness testing: passing a strategy because it excels on one metric while ignoring failures elsewhere.
- Require multi-test consensus. A strategy must pass at least five of the eight core tests (IS/OOS, walk-forward, parameter sensitivity, two Monte Carlo variants, noise test, cross-market, slippage stress) before advancing to paper trading. Excelling on one test while failing two others is not a pass.
- Set percentile thresholds. OOS Sharpe should be a substantial fraction of IS Sharpe. Monte Carlo 5th-percentile drawdown should remain within your maximum acceptable drawdown. The baseline should sit near the middle of its own parameter sweep.
- Confirm regime consistency. Check that the walk-forward matrix shows profitable windows in multiple distinct market regimes. A strategy that only works in bull markets is not robust.
- Apply concrete remediations on failure. If the parameter sweep shows a spike, widen the search neighborhood and re-optimize toward a plateau region. If slippage stress fails, increase the minimum required edge per trade or switch to limit orders. If cross-market validation fails, treat the strategy as instrument-specific and reduce position size accordingly.
- Set monitoring triggers for live trading. Define rollback conditions before going live: for example, set rollback conditions based on live Sharpe trends and drawdown relative to backtested maximums; halt the strategy and review if thresholds are exceeded. Track PBO and DSR diagnostics alongside standard performance metrics.
When robustness tests mislead and what “breaking points” actually tell you
Robustness tests are not infallible. Four failure modes can give you false confidence even after running a full battery.
- Leaky testing: Reusing OOS data during re-optimization is the most common and most costly error. Once a strategy enters validation, freeze parameters completely and treat those results as final. Any re-optimization after seeing OOS results converts your OOS period into a second in-sample period.
- Selection bias: Running 50 strategy variants and reporting only the one that passed all tests inflates your apparent success rate. Count every trial and apply a multiple-testing correction such as DSR.
- Metric search: Switching performance metrics until one looks good is the statistical equivalent of overfitting. Choose your primary metric before running any test.
- Small-sample diagnostics: A backtest with fewer than a few hundred trades may lack sufficient statistical power to distinguish a genuine edge from noise. Most practitioners prefer several hundred trades in the OOS period before trusting results.
The most productive mindset shift is moving from “did this strategy pass?” to “where does this strategy break?” Document the exact conditions — cost level, noise level, parameter value, market regime — at which performance collapses. Those conditions define your live risk limits more precisely than any single backtest metric.
Pro Tip: Before deploying, write a one-page “failure conditions document” for every strategy: the cost level, noise level, and regime that causes it to fail. Review this document every quarter in live trading.
Knowing why strategies fail at the parameter level is as important as knowing that they pass a checklist. The optimization process itself introduces risk when it is not bounded by a principled experiment count and a locked validation protocol.
Key Takeaways
A strategy earns deployment only by passing multiple independent robustness tests — not by excelling on a single backtest metric.
| Point | Details |
|---|---|
| Run at least eight tests | IS/OOS, walk-forward, parameter sweep, two Monte Carlo variants, noise, cross-market, and slippage stress are the minimum battery. |
| Freeze parameters at validation | Never re-optimize after seeing OOS results; any adjustment converts OOS data into a second in-sample period. |
| Document breaking points | Record the cost level, noise level, and regime where performance collapses — these conditions set your live position-sizing limits. |
| Require multi-test consensus | A strategy must pass the majority of independent tests, not just one; a single strong metric does not offset multiple failures. |
| Tickerly for phased deployment | Use Tickerly’s paper-trading and multi-strategy execution to validate live fills against your locked robustness results before scaling capital. |
What I’d prioritize if I were starting a robustness review today
Most traders underestimate how much the order of tests matters. Running Monte Carlo before a parameter sweep wastes compute time — if the strategy is overfit, the Monte Carlo distribution is meaningless. Start with the parameter sweep, confirm you are sitting on a plateau, then run walk-forward analysis to check regime generalization. Monte Carlo comes third, after you know the strategy is not a spike artifact.
The human factor during rollout is consistently underestimated. A strategy that passes every test on paper can still be abandoned prematurely when a live drawdown hits 60% of the backtested maximum and feels much worse than the numbers suggested. Write your rollback triggers and your “this is expected behavior” thresholds before you go live, not during a drawdown.
For automation and execution, Tickerly’s multi-strategy support and TradingView integration make it practical to run paper-trading validation alongside live strategies simultaneously, capturing realistic fills without manual intervention. That parallel paper-to-live workflow is one of the most underused robustness tools available to retail quants.
Tickerly turns validated strategies into live bots without the manual overhead
Once your strategy clears the robustness checklist, the gap between a locked backtest and a live trading bot is where most quants lose time and introduce execution errors. Tickerly closes that gap directly: it converts your TradingView Pine Script alerts into fully automated trading bots, executing across crypto, forex, stocks, and futures exchanges with ultra-fast, API-driven fills.

For robustness validation specifically, Tickerly’s paper-trading mode lets you run your locked strategy against live market data and real order-book conditions before committing capital — the closest thing to a live stress test without actual risk. Its support for automated bots across multiple strategies simultaneously means you can run phased rollouts across several instruments at once, comparing live fill quality against your backtested assumptions in real time. Start your 30-day free trial and connect your first validated strategy to a live exchange in minutes.
Recommended reading and tools for implementing robustness tests
The sources below cover the full testing stack, from data hygiene to Monte Carlo scripting to deployment diagnostics.
| Source | Tests covered | Best for |
|---|---|---|
| Build Alpha — Robustness Testing Guide | Walk-forward, Monte Carlo variants, noise testing, randomized OOS | Practitioners wanting a complete automated testing suite |
| TradeQuantix — Robustness Testing Methods | Parameter sweep, histogram/percentile workflow, workbook template | Quants building a spreadsheet-based testing workflow |
| Algorier — Strategy Robustness Testing | Multi-test framework, regime testing, breaking-point mindset | Traders new to systematic robustness thinking |
| CuteMarkets — PBO and Deflated Sharpe | PBO, DSR, overlap filters, deployability constraints | Quants applying statistical diagnostics to deployment decisions |
| DecodetheFuture — Backtesting Validation | Locked-in validation protocol, leakage prevention, OOS discipline | Developers building reproducible experiment pipelines |
| StrategyQuant | Walk-forward matrix, Monte Carlo, genetic optimization | Traders wanting a GUI-based all-in-one platform |
For code-level implementation, StrategyQuant includes a built-in walk-forward matrix and Monte Carlo engine. Build Alpha provides a dedicated robustness testing suite with histogram outputs and percentile ranking built in. For data quality and reproducible experiment logging, the discipline of knowing your data before running any test is as important as the tests themselves — garbage-in data produces confident-looking but meaningless robustness results.
FAQ
How do you test for robustness in a trading strategy?
Run a battery of at least eight independent tests: in-sample/out-of-sample split, walk-forward analysis, parameter sensitivity sweep, Monte Carlo resampling and sequence randomization, noise/perturbation testing, cross-market validation, slippage stress, and missing-trade simulation. A strategy must pass the majority of these tests, not just one, before it is considered deployable.
What is the 3-5-7 rule in trading strategy?
The 3-5 rule is a position-sizing guideline where no single trade risks more than 3% of capital, and no single sector or correlated group exceeds 5%. It is a risk-management heuristic, not a robustness test, but it pairs well with Monte Carlo drawdown analysis to set live position limits.
Can ChatGPT backtest a trading strategy?
ChatGPT can generate Pine Script or Python code for a backtesting framework, but it cannot execute live backtests, access real market data, or run Monte Carlo simulations on your behalf. You still need a platform like TradingView, Build Alpha, or StrategyQuant to run the actual tests against historical data.
How do you know when a strategy has passed enough tests to deploy?
Require multi-test consensus: the strategy should pass at least five of eight core robustness tests, show OOS Sharpe at least 50% of IS Sharpe, and demonstrate profitable walk-forward windows across at least two distinct market regimes. Then run a paper-trading period of 30–60 days before scaling to full position size.
What is the minimum data length needed for reliable robustness testing?
Most practitioners require a substantial number of trades in the out-of-sample period to gain meaningful statistical power. For daily strategies, this typically requires many years of history; for intraday strategies on liquid instruments, fewer years of minute-bar data may suffice if trade frequency is high enough.