

What is automated position sizing and why does it matter?
Automated position sizing is the use of algorithms to calculate the correct trade size based on your account equity, risk tolerance, stop-loss distance, and asset volatility. Rather than guessing or relying on intuition, the algorithm runs the math before every trade and outputs a specific dollar or unit amount. Position sizing is where many strategies succeed or fail before a trade even has a chance to play out.
The core purpose is capital protection. Every trade carries risk, and without a defined sizing rule, a single bad position can wipe out weeks of gains. The 2% risk-per-trade rule from CME Group is the standard retail benchmark: never risk more than 2% of total account equity on any single trade.
Three inputs drive every automated sizing calculation:
- Account balance: the total equity available, updated in real time
- Stop-loss level: the price at which the trade exits if wrong, defining the per-share risk
- Asset volatility: wider price swings require smaller positions to keep dollar risk constant
Position sizing cannot turn a losing strategy into a winning one. As Investopedia notes, it optimizes capital growth only within a strategy that already has positive expectancy.
How does an automated position sizing system actually work?
The calculation flow is straightforward once you see it laid out. The algorithm takes your inputs, runs a formula, and returns a position size in real time before order submission.
Core inputs the system requires:
- Current account equity (updated after every closed trade)
- Risk percentage per trade (e.g., 1% or 2% of equity)
- Entry price for the planned trade
- Stop-loss price (defines the per-unit risk)
- Leverage ratio and currency pair conversion factor when applicable
The standard calculation:
- Multiply account equity by the risk percentage to get the dollar risk amount.
- Subtract the stop-loss price from the entry price to get the per-unit risk.
- Divide the dollar risk amount by the per-unit risk to get the position size in units.
For example: an account with a 2% risk cap means a fixed dollar amount at risk per trade. If the entry is $100 and the stop is $97, the per-unit risk is $3. The algorithm outputs the appropriate number of units accordingly.
Volatility adjustments add another layer. When an asset’s average true range (ATR) expands, the stop-loss distance widens, and the algorithm automatically reduces position size to keep dollar risk flat. Automated trading systems execute these calculations at speeds no manual trader can match, feeding the result directly into the order management system for real-time execution.

Which position sizing formulas do automated systems use?
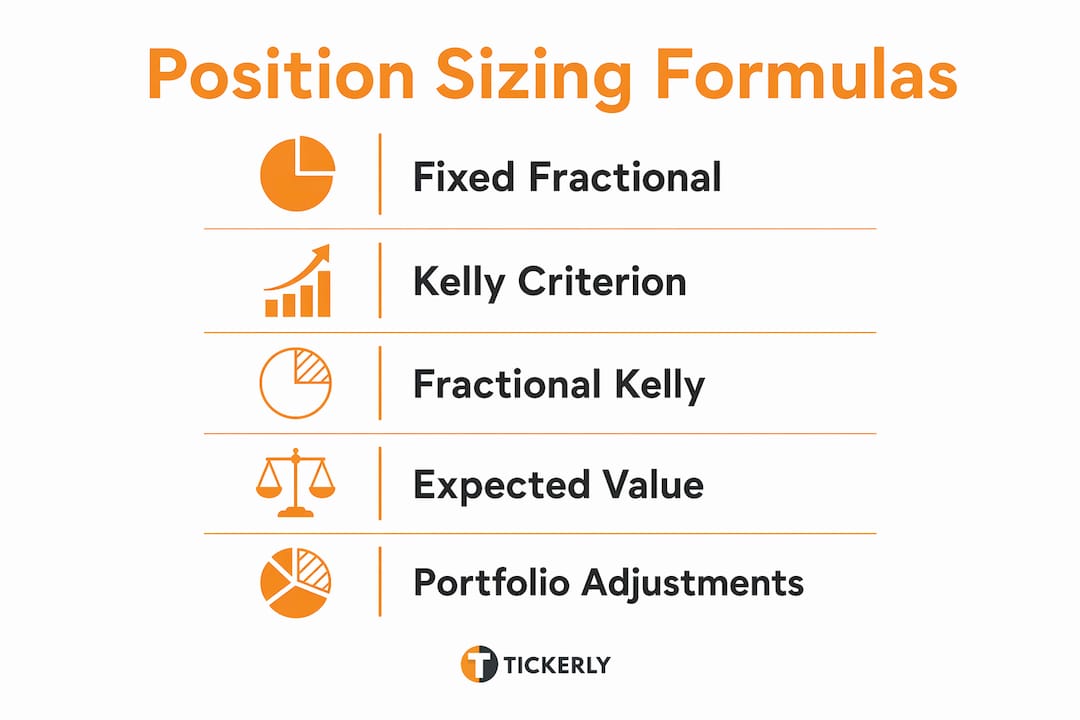
Several mathematical models power automated sizing. Each carries a different risk profile and suits different strategy types.
| Formula | Aggressiveness | Best For |
|---|---|---|
| Fixed fractional | Low to moderate | Beginners, consistent risk control |
| Full Kelly | Very high | Theoretically optimal, rarely used in practice |
| Quarter Kelly | Conservative | Standard recommendation for most traders and volatile markets |
| Expected Value (EV) gate | Variable | Skipping low-edge trades automatically |
Fixed fractional is the simplest approach. You risk a fixed percentage of equity per trade, regardless of edge magnitude. It scales naturally with account growth and drawdown, making it the default for most retail automated systems.
Kelly Criterion is more sophisticated. Developed by J.L. Kelly Jr. at Bell Labs, the formula is: K% = W minus (1 minus W) divided by R, where W is win rate and R is the win/loss ratio. Full Kelly maximizes long-term growth rate but creates severe drawdowns when your probability estimates are even slightly off. Most disciplined traders use fractional Kelly instead.
Fractional Kelly scales the full Kelly output by a multiplier. A 0.25x Kelly (quarter Kelly) is the default in many automated sizing libraries because it resists drawdowns caused by estimation error while still scaling position size with edge.
Expected Value gating adds a minimum edge threshold. If the calculated edge falls below a set floor (for example, 3%), the algorithm returns a zero position size and skips the trade entirely. This prevents the system from entering marginal setups that barely justify the transaction cost.
Portfolio-level adjustments go further. When two correlated positions run simultaneously, sizing each independently overstates the safe allocation. Portfolio-aware Kelly accounts for correlation, issues concentration warnings, and can suggest hedges to reduce overall exposure.
What are the real benefits of automated position sizing?
The most direct benefit is drawdown control. When your sizing algorithm caps risk at 2% per trade, a ten-trade losing streak costs a manageable portion of your account. Conversely, larger per-trade risks can cause severe drawdowns, making recovery very difficult.
Key advantages traders gain from automation:
- Emotion-free discipline: the algorithm applies the same rule every time, regardless of recent wins or losses
- Real-time recalculation: as account equity changes after each trade, the next position size updates automatically
- Multi-strategy management: running several strategies simultaneously requires portfolio-level sizing that no manual process can handle reliably
- Consistent backtesting alignment: live sizing matches the rules tested historically, closing the gap between backtest and live performance
Speed matters too. Automated trading systems execute calculations and submit orders far faster than any human equivalent, capturing entries at the intended price rather than a slipped one.
The 2% rule in practice: An account risking 2% per trade puts a fixed portion of its equity at risk per position. After a stop-loss hit, the next trade automatically recalculates from the updated equity, keeping risk proportional without any manual adjustment.
For traders running long-term profitability strategies, automated sizing is the mechanism that keeps the strategy viable through inevitable losing streaks.
What mistakes do traders make with automated position sizing?
The most common error is using full Kelly without a fractional adjustment. Because real-world probability estimates always carry uncertainty, full Kelly amplifies errors and produces drawdowns that most traders cannot psychologically or financially sustain.
Frequent mistakes to avoid:
- Overestimating edge: a 5-point overestimate in win probability leads to significant oversizing under Kelly; always stress-test your edge assumptions
- Ignoring correlation: sizing two correlated positions independently doubles the effective risk on a shared market event
- Skipping fees and liquidity: fees reduce effective edge, and illiquid markets lock capital longer than expected; both must be subtracted before calculating size
- Treating position sizing as a substitute for stop-loss discipline: sizing controls how much you risk, but a stop-loss controls whether that risk is actually capped
- Hard-coding a fixed size: using a static unit count instead of equity-adjusted sizing means your risk percentage drifts as your account grows or shrinks
Pro Tip: Apply a 0.25x fractional Kelly multiplier as your default. You sacrifice some theoretical growth potential, but you protect the account against the estimation errors that are unavoidable in live trading. Adjust upward only when your edge has been validated across a large sample of live trades.
Sizing each trade within the portfolio context is equally critical. If three strategies all trigger simultaneously on correlated assets, the combined exposure can far exceed your intended risk limit even when each individual trade looks correctly sized.
How should you adjust position sizing as market conditions change?
Static sizing rules break down when market regimes shift. A volatility-adjusted approach keeps dollar risk constant even as price swings expand or contract.
The ATR (Average True Range) is the most practical volatility input. When ATR doubles, the algorithm halves the position size to maintain the same dollar risk per trade. This happens automatically in well-built systems without any manual intervention.
Condition factors that should influence your sizing:
- Realized volatility: higher volatility means wider stops and smaller positions
- Correlation shifts: when previously uncorrelated assets start moving together, reduce total exposure across those positions
- Edge confidence: if recent live performance diverges from backtest expectations, scale down the Kelly multiplier until the discrepancy is understood
- Market regime: trending markets often support larger positions on breakout setups; mean-reversion markets favor smaller, more frequent entries
- Liquidity conditions: thin order books during off-hours or around major news events warrant reduced size to avoid slippage eating into expected edge
Portfolio-level signal endpoints, as used in advanced automated systems, can flag concentration risk and suggest hedges when exposure to a single sector or correlated group exceeds a defined threshold. This kind of automation balances efficiency with the oversight that keeps risk management grounded in real market conditions.
How Tickerly automates position sizing for TradingView traders
Tickerly converts TradingView Pine Script strategies into fully automated trading bots, executing sizing decisions continuously without manual input. The platform connects directly to exchange APIs, so when a TradingView alert fires, Tickerly calculates the position size, submits the order, and logs the execution, all within milliseconds.
What Tickerly delivers for automated sizing:
- Configurable risk limits per trade, applied consistently across every alert
- Real-time position size recalculation based on current account equity
- Support for multiple simultaneous strategies, each with independent sizing parameters
- Emotion-free execution that follows the defined rules regardless of market conditions
- Portfolio-aware management across crypto, forex, and stock positions
The practical outcome is that your TradingView strategy runs exactly as backtested. There is no gap between the rules you defined and the trades that execute. Traders using Tickerly report improved efficiency and the ability to run diversified strategy portfolios that would be unmanageable manually.
Pro Tip: After deploying your bot on Tickerly, monitor the first 20–30 live trades against your backtest expectations. If live sizing deviates from the backtest, check whether your ATR inputs or stop-loss distances have changed in the live environment. Small parameter mismatches compound quickly across many trades.
For traders new to bot-driven sizing, Tickerly’s beginner automation guide walks through the setup process step by step. For those managing risk across multiple bots, the risk management guide covers how to integrate sizing controls at the portfolio level.
Risk management with position sizing
Position sizing and risk management are not separate disciplines. Sizing is the primary mechanism through which risk management operates at the trade level.
The relationship works like this: your risk management framework sets the rules (maximum drawdown tolerance, maximum risk per trade, maximum correlated exposure), and the position sizing algorithm enforces those rules on every single order. Without automated sizing, even a well-designed risk framework collapses under the pressure of discretionary decisions.
A practical risk management structure built around automated sizing includes three layers. The first is trade-level risk, capped by the 2% rule or your chosen percentage. The second is daily loss limits, where the bot pauses execution if cumulative losses exceed a set threshold. The third is portfolio-level exposure limits, where correlated positions are sized down collectively to prevent a single market event from triggering multiple large losses simultaneously.
Stop-loss placement works alongside sizing, not instead of it. The stop defines the per-unit risk that feeds the sizing formula. Widen the stop and the algorithm reduces units. Tighten the stop and it increases units. The dollar risk stays constant either way, which is exactly the point.
Automated position sizing strategies across different asset classes
The same sizing logic applies across markets, but the inputs and constraints differ by asset class.

Crypto: High volatility means ATR-based sizing is especially important. A Bitcoin position sized on a $500 ATR requires far fewer units than the same dollar-risk calculation on a $50 ATR day. Crypto bots connected via API, such as those running through Tickerly’s crypto trading integration, recalculate size on every alert to account for intraday volatility swings.
Forex: Currency pair sizing must account for pip value and leverage. A standard lot on EUR/USD carries $10 per pip. If your stop is 20 pips and your dollar risk is $200, the algorithm outputs exactly one standard lot. Automated forex trading bots handle this conversion automatically, including cross-currency adjustments when the account is denominated in a different currency than the pair being traded.
Stocks and ETFs: Equity sizing is simpler because there is no leverage multiplier in most retail accounts. The algorithm divides dollar risk by the per-share stop distance and rounds to whole shares. For options, the calculation shifts to contract delta and notional exposure, requiring more sophisticated sizing logic.
Futures: Margin requirements and contract multipliers add complexity. A single ES (S&P 500 futures) contract has a $50 multiplier, so a 10-point stop represents $500 of risk per contract. Automated systems must factor the contract multiplier into the sizing formula to avoid accidental over-leverage.
How to backtest automated position sizing strategies
Backtesting a sizing strategy means running your position size rules against historical trade data to evaluate how they would have performed. The goal is not to find the sizing method that produced the highest past returns. The goal is to understand how different sizing rules affect drawdown, recovery time, and long-term growth across a realistic range of market conditions.
A rigorous backtesting process for automated sizing follows this sequence:
- Define the base strategy first. Sizing cannot fix a strategy with negative expectancy. Confirm the entry and exit rules produce a positive edge before testing size variations.
- Apply each sizing method to the same trade log. Run fixed fractional, half Kelly, and quarter Kelly against identical historical trades to compare equity curves side by side.
- Measure drawdown, not just returns. A sizing method that produces higher returns but doubles the maximum drawdown may be unusable in practice. Most traders cannot hold through a major drawdown without abandoning the strategy.
- Test across multiple market regimes. A sizing method that works in a trending market may fail in a choppy one. Include at least one trending period and one mean-reverting period in the backtest window.
- Account for fees and slippage. Backtests that ignore transaction costs overstate edge and lead to oversizing in live trading.
Quantitative backtesting is a core discipline in automated trading system development. Platforms like TradingView allow Pine Script strategies to be backtested with configurable position sizing parameters, giving traders a direct path from backtest to live bot deployment via Tickerly.
Walk-forward testing adds another layer of confidence. Rather than optimizing sizing parameters on the full historical dataset, you optimize on a training window and then test on an out-of-sample period. If the sizing rules hold up out-of-sample, you have a much stronger case for live deployment.
Key Takeaways
Automated position sizing is the single most reliable way to enforce risk discipline across every trade, every session, and every market condition without relying on manual judgment.
| Point | Details |
|---|---|
| The 2% rule is the baseline | Cap risk at 2% of total account equity per trade to survive losing streaks and stay in the game. |
| Fractional Kelly beats full Kelly | A 0.25x Kelly multiplier protects against estimation errors while still scaling size with edge. |
| Correlation requires portfolio sizing | Sizing positions independently when they are correlated overstates the safe allocation and compounds risk. |
| Volatility inputs must update in real time | ATR-based sizing automatically reduces position size when markets become more volatile, keeping dollar risk constant. |
| Backtesting must include fees and drawdown | A sizing method that ignores transaction costs or only measures returns will mislead you about live performance. |
FAQ
What is automated position sizing?
Automated position sizing uses an algorithm to calculate the correct trade size based on account equity, risk percentage, entry price, and stop-loss distance. It removes manual calculation and enforces consistent risk rules on every trade.
How does the Kelly Criterion work in position sizing?
The Kelly Criterion calculates the optimal fraction of capital to risk based on your win rate and win/loss ratio. Most traders use a fractional version (0.25x or 0.5x) rather than full Kelly to reduce drawdown from estimation errors.
What is the standard risk percentage per trade?
The standard retail benchmark is 2% of total account equity per trade. This limits a ten-trade losing streak to roughly 20% drawdown, which is recoverable.
Can position sizing fix a losing strategy?
No. Position sizing optimizes capital growth only within a strategy that already has positive expectancy. It cannot make an unprofitable strategy profitable.
How does Tickerly automate position sizing?
Tickerly converts TradingView Pine Script strategies into live trading bots that execute sizing calculations and order submissions automatically. Configurable risk limits and real-time equity updates keep every trade sized according to your defined rules. Learn more about automated bot efficiency on the Tickerly platform.