

TL;DR:
- Overfitting in trading occurs when strategies memorize noise in historical data rather than true market patterns. This leads to excellent backtest results that fail in live markets, often due to excessive parameter testing and data mining. Preventing overfitting involves disciplined trial tracking, choosing simpler strategies, and validating across assets and regimes.
Overfitting in trading is defined as the process of fitting a strategy so tightly to historical data that it captures random noise instead of genuine, repeatable market patterns. The result is a model that looks exceptional in backtesting but collapses when exposed to live markets. This failure mode is the primary cause of backtest failure in live trading, and it affects quant developers, algorithmic traders, and discretionary traders who rely on systematic rules. Understanding it is not optional. It is the foundation of every durable trading strategy.
What is overfitting in trading and why does it happen?
Overfitting, known formally in quantitative finance as data snooping bias or backtest overfitting, occurs when a model memorizes the specific quirks of a historical dataset rather than learning its underlying structure. Think of it this way: a strategy that only works because it avoided every crash in your training data has not learned risk management. It has memorized a calendar.

The core mechanism is straightforward. Every time you adjust a parameter, add a filter, or test a new rule, you are running a trial against your historical data. Iterative tuning is data mining, and each trial increases the probability that your final result is a statistical accident rather than a real edge. This is the multiple testing problem, and it is the single most critical variable in overfitting.
The ratio of parameters to available data makes the problem worse. Excessive degrees of freedom relative to limited independent observations causes parameter mining, where combinations of rules produce impressive historical results purely by chance. A strategy with seven parameters tested across five years of daily data has far fewer independent observations than it appears to have.
How does overfitting develop during strategy building?
Most overfitting does not happen in a single session. It accumulates across weeks or months of iterative refinement. Here is how the trap typically closes:
-
Parameter mining: You test 50 combinations of a moving average crossover. The best result looks strong. You keep it. You have now used one trial, but psychologically you treat it as a confirmed signal.
-
Filter stacking: You add a volume filter to remove bad trades. Then a volatility filter. Then a time-of-day restriction. Each addition improves the backtest. Each addition also consumes degrees of freedom.
-
Regime selection: You restrict the strategy to bull markets because it underperforms in bear markets. The backtest improves. The strategy now has no tested behavior for 40% of real market conditions.
-
Survivorship bias: You test only on assets that are still trading today, removing the historical failures that would have hurt your results.
Increasing from 2 to 7+ parameters inflates the combinatorial search space exponentially, producing spurious results that have no predictive value. Each added parameter multiplies the number of possible configurations, and the probability of finding a great-looking but meaningless result grows with every combination you test.
The psychological trap is equally dangerous. Traders naturally feel progress when a backtest improves. Accepting a noisier, less impressive equity curve feels like failure. This bias pushes you to keep refining until the curve looks clean, which is precisely when the strategy becomes most fragile.
Pro Tip: Keep a written trial log from day one of strategy development. Record every parameter combination you test, every filter you add, and every rule you discard. This log is your defense against unconscious data mining.
What are the signs of overfitting in trading models?
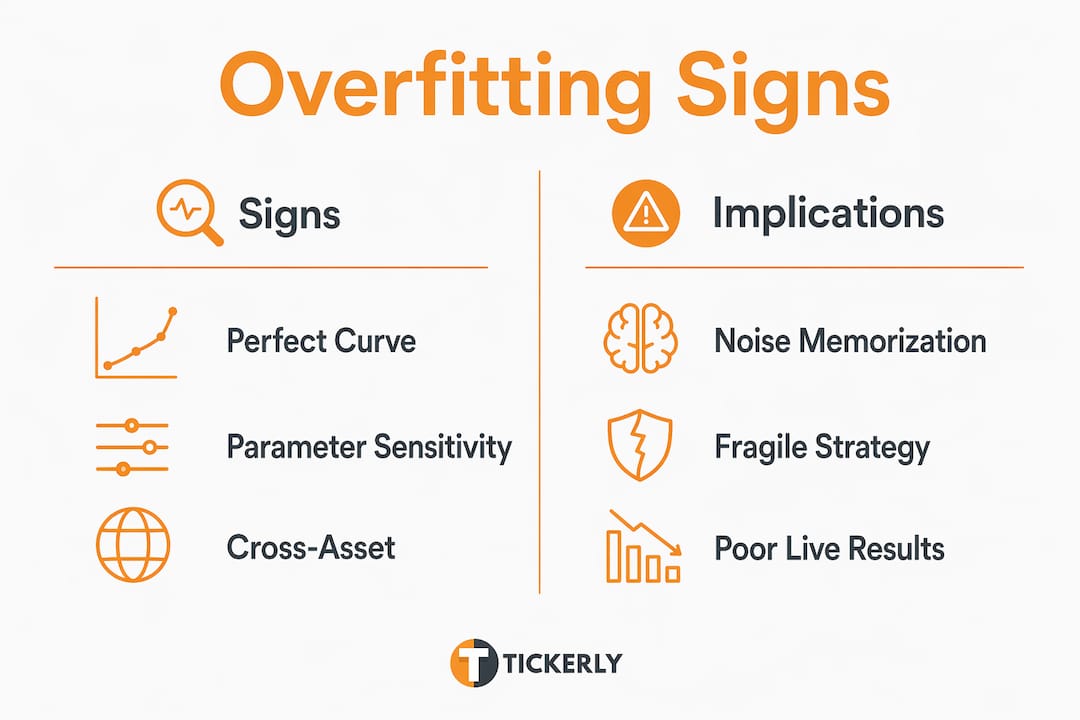
The clearest sign of an overfit strategy is a perfect backtest equity curve. Real market edges produce noisy, uneven results. A smooth, steadily rising equity curve with minimal drawdowns is almost always a sign that the model has memorized historical data rather than identified a genuine pattern.
| Warning sign | What it means | Severity |
|---|---|---|
| Flawless equity curve | Strategy has memorized noise, not learned structure | Critical |
| Sharp performance peaks | Minor parameter changes cause large result swings | High |
| Cross-asset failure | Strategy only works on the asset it was trained on | High |
| Low trade count | Insufficient statistical sample for reliable conclusions | Medium |
| Extreme parameter values | Optimal settings sit at unusual boundaries, not logical ranges | Medium |
Parameter sensitivity is one of the most reliable diagnostics available. Robust strategies maintain profitability across a range of parameter values. Overfit strategies show what researchers call a plateau of fragility: a sharp performance peak surrounded by steep drops on either side. If moving your moving average period from 14 to 15 cuts your Sharpe ratio in half, the strategy is fragile.
Cross-asset validation is another fast test. A genuine edge in equity momentum should show some signal across multiple equity markets, not just the single ticker you optimized on. Failure to transfer across related assets is a strong indicator of noise fitting.
Pro Tip: Run a parameter sensitivity heatmap before committing to any strategy. Plot performance across a grid of your two most important parameters. A robust strategy shows a broad, flat plateau of acceptable results. A fragile one shows a single bright spot surrounded by red.
You can also use the Deflated Sharpe Ratio to quantify overfitting risk. This metric adjusts your observed Sharpe ratio downward based on the number of trials you ran during development. The more trials you ran, the more skeptical the metric becomes about your final result.
What is the real impact of overfitting on trading performance?
Overfitting does not just reduce returns. It generates negative expected returns out of sample on time series with memory, transforming a no-edge strategy into a negative-edge one. The more severe the overfit, the worse the live performance. This is not a minor performance drag. It is a structural inversion of your expected results.
The practical consequences compound quickly:
-
False confidence: A strong backtest creates conviction. Traders size positions larger and hold through drawdowns longer because they trust the model. When the model fails, the losses are larger than they would have been without the backtest.
-
Delayed recognition: Overfit strategies often show early live losses that traders attribute to bad luck or unusual market conditions. This delays the decision to stop trading the strategy, extending the loss period.
-
Capital destruction: Persistent losses from an overfit strategy consume capital that could have been deployed in a genuinely tested approach.
-
Psychological damage: Repeated failures from strategies that looked perfect in backtesting erode confidence in systematic trading altogether.
The deeper structural issue is that overfitting is not just a modeling error. It reflects flawed assumptions about data independence, market stationarity, and the relationship between historical and future behavior. A strategy built on too many parameters relative to data will always carry this structural weakness, regardless of how good the backtest looks. You can read more about these failure patterns in this guide on why trading strategies fail.
How to avoid overfitting in trading: proven methods
Preventing overfitting requires discipline at every stage of strategy development. These methods are evidence-based and directly address the mechanisms that cause the problem.
-
Track your trial count from the start. Every parameter test, filter addition, and rule modification counts as a trial. Use the Deflated Sharpe Ratio to adjust your performance expectations based on total trials. Out-of-sample testing alone does not eliminate overfitting if trial counts are not controlled.
-
Apply the 10-trades-per-parameter rule. A 10-trades-per-parameter baseline provides a minimum threshold for statistical robustness. With multiple market regimes in your data, that requirement multiplies. A strategy with five parameters needs at least 50 trades per regime to be considered statistically meaningful.
-
Separate your data strictly. Divide your historical data into in-sample (development), out-of-sample (validation), and walk-forward (final test) segments before you begin. Never touch the out-of-sample data until development is complete. Any peek at that data contaminates it.
-
Limit degrees of freedom. Favor strategies with fewer parameters. A three-parameter strategy that works is worth far more than a seven-parameter strategy that looks better in backtesting. Check your parameter-to-data ratio before finalizing any model.
-
Use robust objective functions. Traditional optimization targets like maximum profit or maximum Sharpe ratio reward overfitting. Objective functions like GT-Score penalize fragility and reward consistent performance across parameter ranges. Using robust objective functions like GT-Score reduces overfitting by 98% relative to traditional optimization methods. That is not a marginal improvement. It is a fundamental change in what you are optimizing for. Tickerly’s optimization tools support this approach directly. You can explore the reasoning behind it in this guide on why optimize trading strategies.
-
Validate across assets and regimes. Test your strategy on assets it was not trained on. Test it across bull markets, bear markets, and sideways regimes. A genuine edge should show some signal across conditions, even if performance varies. Improving your stock trading workflow to include cross-asset validation catches fragile strategies before they reach live capital.
Key Takeaways
Overfitting in trading destroys live performance by fitting strategies to historical noise, and preventing it requires strict trial tracking, parameter parsimony, and robust objective functions like GT-Score.
| Point | Details |
|---|---|
| Overfitting defined | A strategy memorizes historical noise instead of learning repeatable market patterns. |
| Primary cause | The multiple testing problem: each trial during development increases false discovery risk. |
| Critical warning sign | A perfect equity curve signals memorization, not a genuine edge. |
| Deflated Sharpe Ratio | This metric adjusts performance expectations based on total trials run during development. |
| Best prevention method | Combine trial tracking, parameter parsimony, and GT-Score optimization to build durable strategies. |
Why I think most traders underestimate the overfitting trap
After years of working with systematic strategies across crypto, forex, and equities, the pattern I see most often is not reckless trading. It is disciplined traders who overfit their way to failure. They do everything right on the surface: they backtest carefully, they use out-of-sample data, they check their Sharpe ratios. But they never count their trials.
The uncomfortable truth is that a strategy developed over three months of daily refinement may have accumulated hundreds of implicit trials, even if you only formally tested a handful of parameter sets. Every time you looked at the equity curve and decided to “try one more thing,” that was a trial. The Deflated Sharpe Ratio exists precisely because researchers recognized that human development processes are inherently iterative, and that standard metrics do not account for this.
The other trap I see is the pursuit of the perfect backtest. Traders treat a noisy, uneven equity curve as a sign that the strategy needs more work. In reality, a robust strategy shows uneven, noisy performance because real market edges are inconsistent. The moment your backtest looks too good, you should become more skeptical, not more confident.
My practical advice: set a hard limit on the number of parameter combinations you will test before committing to a strategy. Write it down before you start. When you hit that limit, you either have a strategy worth validating or you move on. This discipline is harder than any technical fix, but it is the one that actually works. You can also review effective backtesting methods to build a more structured validation process from the start.— Jay
How Tickerly helps traders build strategies that hold up live
Overfitting is a development problem, but it becomes a live trading problem the moment you deploy a fragile strategy. Tickerly connects your TradingView Pine Script strategies directly to live exchanges, which means the gap between your backtest and your live execution is as small as it can be.

Tickerly’s automation layer removes the execution variables that can mask strategy weakness in manual trading. When your strategy runs as an automated trading bot with consistent, emotion-free execution, you get clean live data fast. That data tells you quickly whether your strategy holds up out of sample or whether it was overfit. Tickerly supports multiple simultaneous strategies, so you can run parallel validation across assets and regimes without manual overhead. Faster feedback means faster iteration, and faster iteration means less capital at risk during the validation phase.
FAQ
What is overfitting in trading, simply explained?
Overfitting in trading occurs when a strategy is tuned so closely to historical data that it captures random noise instead of real patterns. The strategy performs well in backtesting but fails in live markets.
How does the Deflated Sharpe Ratio detect overfitting?
The Deflated Sharpe Ratio adjusts your observed Sharpe ratio downward based on the total number of trials run during strategy development. It accounts for the multiple testing problem that standard metrics ignore.
What is a safe number of parameters for a trading strategy?
A baseline rule requires at least 10 trades per parameter in your backtest. A strategy with five parameters needs a minimum of 50 trades per market regime to be considered statistically reliable.
Can out-of-sample testing fully prevent overfitting?
Out-of-sample testing alone does not eliminate overfitting if you do not control your total trial count. Each time you peek at out-of-sample results and adjust your strategy, that data becomes contaminated.
What is the plateau of fragility in trading models?
The plateau of fragility describes a strategy whose performance peaks sharply at one parameter setting and drops steeply on either side. Robust strategies show broad, flat performance plateaus across a range of parameter values.