

An automated multi-timeframe strategy uses a higher timeframe for directional bias and a lower timeframe for entry timing, then executes both rules automatically without a trader watching the screen. The payoff: cleaner entries, fewer false signals from single-timeframe noise, and emotion-free execution. Active traders, Pine Script developers, and algo builders benefit most, since the logic rewards precise, testable rules over gut calls.
TL;DR:
Using a higher timeframe for trend bias and a lower timeframe for entry reduces noise and false signals in automated trading systems.
Maintaining approximately a 3 to 4x ratio between timeframes ensures each layer provides distinct information without redundancy.
Critical synchronization involves pulling data from a single source, waiting for full candle close, and logging timestamps to prevent mismatched signals.
Conflict resolution methods like hierarchy weighting or majority vote help manage opposing signals across timeframes, with explicit rules preventing ambiguity.
Validating strategies through realistic backtesting, proper risk controls, and continuous monitoring safeguards against operational errors and data drift.
Table of Contents
-
Automation Architecture: Components, Latency, and Sync Rules
-
Implementation Checklist: From TradingView Alert to Live Bot
-
Optimizing Performance and Scalability in Multi-Timeframe Systems
-
Common Pitfalls and Debugging Tips for Multi-Timeframe Automation
-
Author Jay’s Perspective: Tradeoffs and Practical Expectations
-
Turning Your Multi-Timeframe Rules Into a Live Bot With Tickerly
What Is Multi Timeframe Strategy Automation, Really?
Top-down trading starts with the higher timeframe (HTF) to set bias, then drops to a lower timeframe (LTF) to time entries. Bottom-up flips that order, scanning the LTF for setups and checking the HTF afterward for confirmation. Most professional systems favor top-down because it filters out trades that fight the dominant trend before you ever risk capital.
Markets are fractal: the same chart pattern that plays out on a 4-hour chart tends to echo on a 15-minute chart. Aligning multiple timeframes exploits that structure, and the Multi-Timeframe Strategies notebook documents this as the classic practice: HTF for trend, LTF for entry, with three-timeframe alignment reducing noise further.
A few working rules of thumb worth coding into any strategy:
-
Keep roughly a 3 to 4x ratio between adjacent timeframes (1H to 15M, or 4H to 1H) so each layer adds distinct information instead of duplicating the last.
-
Let the LTF override HTF bias only on a genuine structural break, such as a volume spike through a key level, not just a minor wiggle.
-
Treat HTF alignment as a filter, not a trigger. It tells you whether to look for trades, not when to pull one.
Choosing Timeframes That Match Your Trading Style
The right timeframe stack depends on how long you intend to hold a position and how much noise you can tolerate. Scalpers need fast confirmation loops; swing traders need patience baked into the code.
| Trading style | Higher timeframe (bias) | Mid timeframe (structure) | Lower timeframe (entry) |
|---|---|---|---|
| Scalping | 1H | 15M | 1M to 5M |
| Day trading | 4H | 1H | 5M to 15M |
| Swing trading | Daily | 4H | 1H |
| Position trading | Weekly | Daily | 4H |
Volatility regime should shift these choices too. When realized volatility spikes, a system built to detect it can automatically widen the LTF window to avoid overtrading noisy candles, an adaptive approach the Multi-Timeframe Strategies notebook confirms helps preserve win rate across changing conditions. Before trusting any stack, validate it against your specific symbol: run a rolling correlation between HTF trend direction and LTF entry outcomes over at least a full market cycle, not just a few weeks of clean trending price action.
Four Strategy Patterns Worth Automating
Multi-timeframe rules only pay off when they’re specific enough to code and test. Four patterns come up repeatedly across trading with multiple timeframes, and each translates cleanly into automation logic.
-
Trend-following pullback. Confirm HTF trend direction, wait for an LTF pullback to a moving average or Fibonacci zone, enter on the bounce, and place the stop below the HTF swing low rather than a tight LTF wick.
-
Breakout with HTF confirmation. Require price to clear an HTF resistance or support level, then use an LTF volume or momentum trigger to time entry, filtering out breakouts that reverse within one or two candles.
-
Range strategy. Mark the HTF value area for stop and target placement, then execute LTF mean-reversion entries near the range edges, exiting when price returns to the midpoint.
-
Three-timeframe alignment. Require agreement on direction across HTF, mid, and LTF before any entry fires, the strictest filter and typically the one with the fewest but highest-quality signals.
Pro Tip: Backtest each pattern in isolation before combining them. A three-timeframe alignment rule layered on top of a breakout filter can look great on paper but quietly cut your trade frequency to almost nothing, starving the strategy of statistical significance.
Automation Architecture: Components, Latency, and Sync Rules
Building a system that actually holds multiple timeframes in sync requires more than a single indicator script. According to research on automated algo trading infrastructure, a working multi-timeframe system needs a market data adapter, a synchronization engine, a signal processor, and an order manager wired into risk controls.
The core components break down as:
-
A market data adapter that normalizes feeds from your exchange or broker into consistent candle structures.
-
A timeframe synchronization engine that aligns candle closes across HTF, mid, and LTF streams before any signal fires.
-
A signal processor that evaluates your strategy logic once synchronized data is available.
-
An order manager that translates signals into exchange-specific order instructions.
-
A risk management system enforcing position sizing and exposure limits.
-
Monitoring and a kill switch that can halt trading instantly if behavior deviates from expected ranges.
Sub-second execution matters when you’re trading breakouts on 1-minute charts where slippage compounds fast. It matters far less for swing setups built on daily bias, where a few seconds of latency changes nothing. Candle boundary mismatches between data vendors are a frequent failure point, so cross-provider candle comparisons and timezone-normalized sampling should be part of any pre-launch test.
Backtesting, Walk-Forward Testing, and Risk Controls
A backtest that ignores slippage and commission will always look better than the live system that follows it. Realistic transaction costs, a proper out-of-sample or walk-forward split, and a large enough sample size are the minimum bar before trusting any multi-timeframe rule with real capital.
Track these metrics across both backtest and forward test:
-
CAGR, so you know the return is worth the operational overhead.
-
Maximum drawdown, since multi-timeframe filters can mask concentrated losing streaks.
-
Sharpe or Sortino ratio, to judge risk-adjusted performance rather than raw return.
-
Expectancy per trade, along with the full win/loss distribution rather than just the average.
A robust automated trading architecture centralizes order management with strategy-level and global risk management systems (SLRMS and GRMS), pairing that with dedicated pre-launch testing and continuous monitoring after deployment. Circuit breakers and per-strategy caps aren’t optional extras. Past market disruptions traced to malfunctioning automated trading systems are the reason regulators and serious trading desks alike now treat kill switches as standard equipment, not a nice-to-have bolted on after something breaks.
Implementation Checklist: From TradingView Alert to Live Bot
Turning a validated multi-timeframe rule into a live bot is a sequence, not a single leap. Skipping steps here is where most automation projects fail quietly.
-
Write and unit-test the Pine Script logic separately for HTF bias detection and LTF entry triggers, confirming each fires independently before combining them.
-
Standardize your alert payload structure, including symbol, side, quantity, stop, take-profit, and timestamp, so parsing never breaks on an unexpected field.
-
Validate that your automation adapter correctly parses every payload variant your strategy can generate, including edge cases like partial fills or rejected orders.
-
Paper trade the full pipeline with real-time latency logging to catch sync issues before they touch live capital.
-
Enable your risk management system and kill switch, then scale position size conservatively over the first several weeks of live trading.
The full walkthrough for connecting TradingView strategy automation alerts to live order execution covers payload formatting in more detail if you’re building this for the first time.
Handling Time Lag and Data Synchronization Challenges
The single most common reason a multi-timeframe bot misfires isn’t bad logic. It’s a candle on one timeframe closing at a slightly different moment than the corresponding candle on another, so your signal processor evaluates stale or mismatched data.
Exchanges and data providers don’t always agree on exactly when a candle closes, particularly around daily and weekly boundaries where timezone conventions differ. A daily candle that closes at midnight UTC on one feed might close at 5:00 PM EST on another, and if your HTF bias check reads from one source while your LTF entry check reads from another, you get bias and trigger evaluated against two different realities.
Three practical fixes solve most of this:
-
Pull all timeframes from a single data source whenever possible, rather than stitching together feeds from multiple exchanges or brokers.
-
Build an explicit synchronization step that waits for both HTF and LTF candles to fully close before evaluating any combined signal, rather than reacting the instant a lower timeframe candle prints.
-
Log every timestamp your system touches, in both the exchange’s native timezone and UTC, so a debugging session doesn’t turn into guesswork about which clock was right.
Time lag also shows up in a subtler form: the delay between when a signal fires and when the order manager places the trade. On fast-moving breakout setups, even a one or two second gap can mean the difference between a good fill and a chase. This is exactly where execution speed separates automation platforms that treat latency as a design priority from those that treat it as an afterthought.
Techniques to Manage Conflicting Signals Between Timeframes
Conflicting signals are the default state of multi-timeframe trading, not the exception. Your daily chart says uptrend, your 15-minute chart says sell. The question isn’t how to eliminate disagreement. It’s how to build a rule that resolves it consistently instead of leaving it to a discretionary judgment call at 2 AM.
Four approaches handle this well in automated systems:
Hierarchy weighting. Assign the HTF final say on direction and let the LTF only decide timing, never direction. This is the simplest rule and the one most trend-following pullback strategies use by default.
Majority vote across three timeframes. Require at least two of three timeframes to agree before a trade fires, which tolerates one noisy timeframe without freezing the whole system. This is the three-timeframe alignment approach, and research on multi-timeframe agreement shows it materially cuts false signals compared to single-timeframe rules.
Conditional overrides. Allow the LTF to override HTF bias only under defined structural conditions, such as a volume surge through a key level, and log every override event separately so you can audit whether they’re actually adding value over time.
No-trade zones. When timeframes disagree and none of your override conditions are met, code the system to simply stand aside. A missed trade costs nothing. A bad one costs capital and confidence.
Whichever method you choose, pick one and code it explicitly. The worst outcome is a strategy that resolves conflicts differently depending on which code path executes first, an inconsistency that’s nearly impossible to debug after the fact.
Optimizing Performance and Scalability in Multi-Timeframe Systems
A single multi-timeframe strategy watching one symbol runs fine on modest hardware. The problems start when you scale to dozens of symbols and multiple strategies running in parallel, each needing synchronized data across three or more timeframes simultaneously.
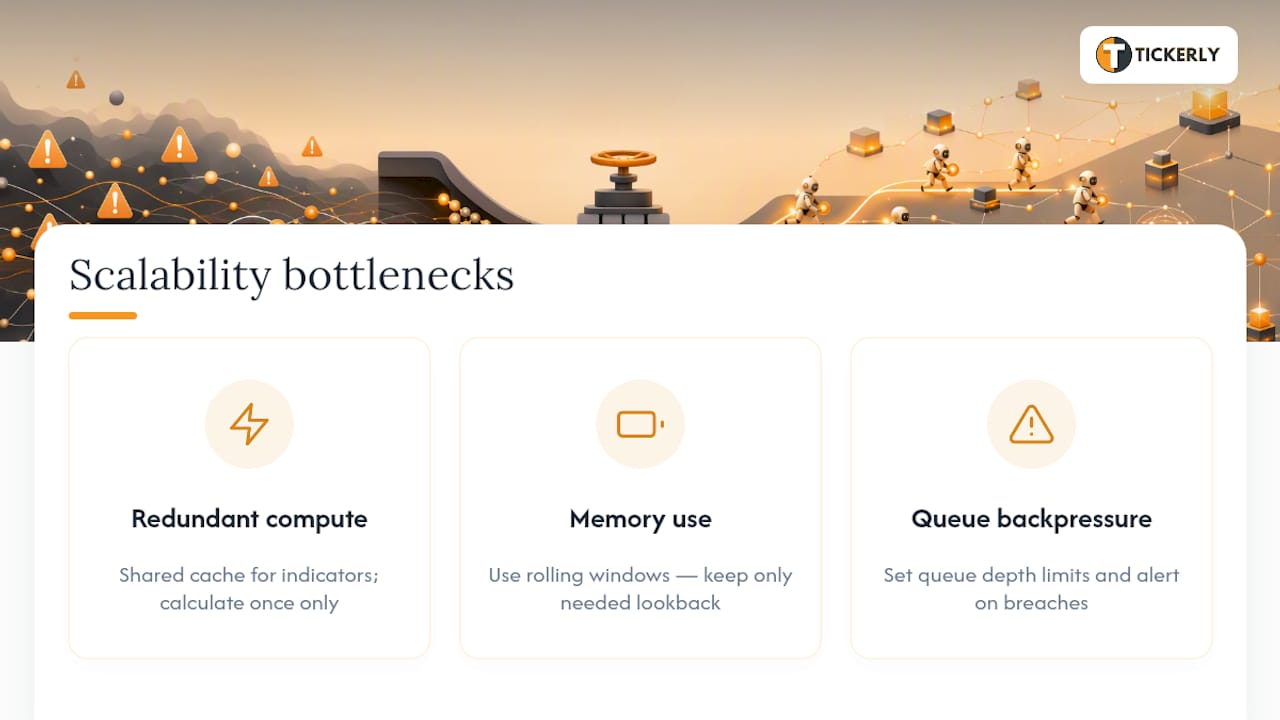
The biggest performance drain is usually redundant computation. If five strategies all need a 4-hour EMA on the same symbol, calculating it five times instead of once multiplies your compute load for no benefit. Centralizing indicator calculations in a shared cache that multiple strategies read from is one of the most effective scalability wins available, and it costs nothing in signal quality.
Memory management matters more than most developers expect going in. Holding full historical candle arrays for every timeframe, on every symbol, adds up fast. Rolling windows that keep only the lookback period your indicators actually need, rather than the full history, keep memory use predictable as you add symbols.
Database or queue backpressure is the other common bottleneck. When market data ticks arrive faster than your synchronization engine can process them, especially during high-volatility opens, queued messages pile up and your signals start firing on stale data without any obvious error. Setting explicit queue depth limits and alerting when they’re breached catches this before it silently corrupts your signals.
Automated trading systems that scale across many simultaneous strategies depend on this kind of centralized, per-strategy resource management as much as they depend on the trading logic itself. A system that runs beautifully with one strategy on one symbol can fall over entirely at twenty strategies across ten symbols if the underlying architecture wasn’t built to share resources efficiently from day one.
Common Pitfalls and Debugging Tips for Multi-Timeframe Automation
Most multi-timeframe automation failures trace back to a handful of repeat offenders, and knowing them in advance saves weeks of confused debugging later.
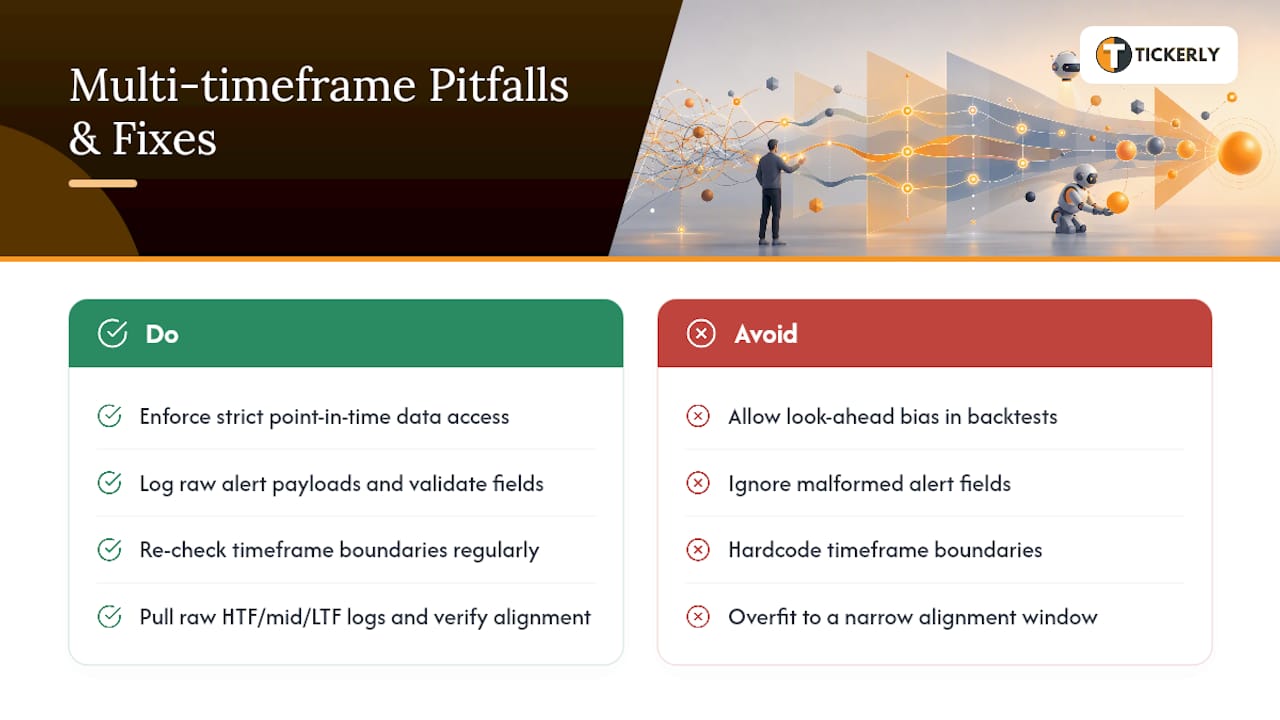
Look-ahead bias in backtests. This is the most dangerous and hardest to spot. If your backtest engine lets the strategy see the HTF candle’s close before that candle has actually closed in real time, your results will look far better than live performance ever will. Always confirm your backtesting framework enforces strict point-in-time data access across every timeframe.
Silent alert payload failures. A malformed alert that drops a field, say the stop-loss value, might not throw an error. It might just get silently ignored or default to a value you didn’t intend. Logging every raw payload before parsing, and alerting on any field that fails validation, catches this before it costs money.
Timeframe drift after exchange maintenance windows. Exchanges occasionally shift candle boundaries after maintenance or during daylight saving transitions. A system that hardcodes timeframe boundaries without re-checking them periodically can drift out of sync for days without anyone noticing.
Overfitting to a narrow alignment window. A three-timeframe alignment rule tuned on six months of trending data often collapses the moment the market chops sideways. Test explicitly across both trending and ranging periods before trusting the rule.
When something does break, the fastest debugging path is almost always the same: pull the raw timestamped logs for HTF, mid, and LTF data at the moment of the failed trade, and manually verify candle alignment before assuming the strategy logic itself was wrong. More often than not, the logic was fine and the data sync wasn’t.
Author Jay’s Perspective: Tradeoffs and Practical Expectations
Automation doesn’t eliminate emotional trading mistakes so much as replace them with operational ones. A bot won’t panic-sell, but it will happily execute a broken alert payload a thousand times if nobody’s watching the monitoring dashboard. Start with the simplest version of your multi-timeframe rule, validate it thoroughly, and only add adaptive features once the base case is proven. Overfitting a three-timeframe alignment rule to six months of clean trend data is easy and worthless. The traders who succeed with this treat operational discipline, logging, monitoring, kill switches, as more important than squeezing out one more percentage point of backtested edge.
— Jay
Turning Your Multi-Timeframe Rules Into a Live Bot With Tickerly
Once your HTF bias and LTF entry logic is backtested and the alert structure is standardized, the remaining gap is execution. Our platform converts your TradingView alerts directly into live trading bots, connecting to various exchange platforms and running multiple simultaneous strategies without requiring a VPS or custom code.

The practical next step: standardize your alert payloads exactly as outlined in the implementation checklist above, pick the multi-timeframe rule you’ve already validated in backtesting, and connect it through Tickerly’s TradingView automation integration. From there, compare the Level 2, Level 3, Level 4, and Level 4 Ultra plans against how many strategies and alerts your setup needs, starting with the tier that matches your current symbol and strategy count. Start your automation with a plan sized to your actual multi-timeframe rule set, not the one you might build someday.
Sources
For deeper technical grounding beyond this guide, the Multi-Timeframe Strategies notebook and the automated trading system architecture guide both offer implementation-level detail worth revisiting as you build.
FAQ
How Do You Analyze Multiple Timeframes at Once?
Start with the highest timeframe to establish trend bias, then step down to a middle timeframe to confirm structure, and finally use the lowest timeframe to time entry. Automated systems encode this as a sequential check, evaluating HTF bias first and only scanning the LTF for entries when that bias is confirmed.
Is It Realistic to Make $1,000 a Day Day Trading?
Daily results vary enormously with account size, volatility, and risk tolerance, and there’s no fixed formula that guarantees a specific dollar figure. A more reliable goal for automated multi-timeframe strategies is consistent risk-adjusted performance measured over months, tracked through metrics like expectancy and maximum drawdown rather than a single day’s target.
What Is the 3-5-7 Rule in Trading?
The 3-5-7 rule is a risk-management guideline suggesting you risk no more than 3% of capital on any single trade, cap total exposure at 5% across correlated positions, and keep your largest winning trade contributing no more than 7% of overall profit for balance. It’s a position-sizing heuristic, not a signal-generation method, and works well layered on top of any multi-timeframe entry rule.
What Is the 5-8-13-21 EMA Strategy?
This approach uses four exponential moving averages, the 5, 8, 13, and 21 periods, based on the Fibonacci sequence, to gauge short-term momentum and trend alignment. Traders often combine it with a higher timeframe bias check, treating EMA alignment on the lower timeframe as the entry trigger once HTF direction is confirmed.
How Much Does Multi-Timeframe Strategy Automation With Tickerly Cost?
Tickerly’s automated trading plans start at $19 per month for Level 2, with Level 3 at $29, Level 4 at $39, and Level 4 Ultra at $89 per month, scaled by asset classes, strategy count, and alert limits. Each tier supports converting TradingView alerts into live bots across supported exchanges.
Recommended
This article was produced with Al assistance and reviewed for accuracy. It is provided for general information only and is not professional or financial advice.